
Comparison of Timber Measurement Methods and Conversion Factors for Scots Pine
doi: https://doi.org/10.5552/crojfe.2026.3606
volume: 47, issue: 1
pp: 14
- Author(s):
-
- Berendt Ferréol
- Bajalan Iman
- Arndt Fabian
- Engler Benjamin
- Cremer Tobias
- Article category:
- Original scientific paper
- Keywords:
- timber assortments, opto-electronic measurement, conversion factor, stack volume, truck scanning
Abstract
HTML
Accurate assessment of log and stack volumes is essential for predicting product yields and supporting decision-making in the forest industry. Despite the need to understand stack and log measurement metrics, this remains challenging due to new technological trends, complicated measurement methods, significant variation between regions, species, products, sizes, and age classifications, and prevailing misconceptions about measurement units. The main aim of this study was to compare several currently used log and timber stack volume measurement methods. Additionally, volume conversion factors from gross stack volume to net solid wood volume were calculated. To this end, Scots pine (Pinus sylvestris L.) stands were harvested using a John Deere 1170G harvester. The wood was measured using different methods and technology, including opto-electronic log measurements, manual volumetric timber stack measurements, and photo-optical stack measurements for sawmill, pallet, and other industrial partners. Conversion factors were calculated (dividing the solid wood volume under bark by the gross stacked volume over bark, including air spaces) to convert the gross stack volume into a net or solid wood volume under bark, which is an important unit for roundwood purchasing. The log measurement results showed significant differences between the various wood measurement methods across all assortments. In particular, significant differences were observed between harvester and sawmill measurements. Additionally, a comparison between manual sectional stack measurement and truck load scanning at the sawmill revealed significant differences for the medium-density fibreboard (MDF) timber assortment. Conversion factors ranged from 0.50 to 0.66, with a mean of 0.596, lower for LAS 3 m timber and higher for LAK timber. The results will contribute to a better understanding and general harmonisation of different methods for measuring stacks based on a series of studies of Scots pine assortments.
Comparison of Timber Measurement Methods and Conversion Factors for Scots Pine
Ferréol Berendt, Iman Bajalan, Fabian Arndt, Benjamin Engler, Tobias Cremer
https://doi.org/10.5552/crojfe.2026.3606
Abstract
Accurate assessment of log and stack volumes is essential for predicting product yields and supporting decision-making in the forest industry. Despite the need to understand stack and log measurement metrics, this remains challenging due to new technological trends, complicated measurement methods, significant variation between regions, species, products, sizes, and age classifications, and prevailing misconceptions about measurement units. The main aim of this study was to compare several currently used log and timber stack volume measurement methods. Additionally, volume conversion factors from gross stack volume to net solid wood volume were calculated. To this end, Scots pine (Pinus sylvestris L.) stands were harvested using a John Deere 1170G harvester. The wood was measured using different methods and technology, including opto-electronic log measurements, manual volumetric timber stack measurements, and photo-optical stack measurements for sawmill, pallet, and other industrial partners. Conversion factors were calculated (dividing the solid wood volume under bark by the gross stacked volume over bark, including air spaces) to convert the gross stack volume into a net or solid wood volume under bark, which is an important unit for roundwood purchasing. The log measurement results showed significant differences between the various wood measurement methods across all assortments. In particular, significant differences were observed between harvester and sawmill measurements. Additionally, a comparison between manual sectional stack measurement and truck load scanning at the sawmill revealed significant differences for the medium-density fibreboard (MDF) timber assortment. Conversion factors ranged from 0.50 to 0.66, with a mean of 0.596, lower for LAS 3 m timber and higher for LAK timber. The results will contribute to a better understanding and general harmonisation of different methods for measuring stacks based on a series of studies of Scots pine assortments.
Keywords: timber assortments, opto-electronic measurement, conversion factor, stack volume, truck scanning
1. Introduction
Approximately 1.15 billion hectares of the world's forests are managed to produce various timber and non-timber forest products (FAO 2020). The demand for wood is increasing in global markets mainly due to (i) higher consumption of traditional timber products, including boards (ii) the ever-growing global energy demand, and (iii) the call for a bio-economy aimed at replacing fossil-based products (Ingrao et al. 2018). Globally, the share of timber products and wood as a renewable energy source is substantial (FAO 2020). It is therefore essential to ensure the stability of the entire supply chain for forest products and related industries (Freyburger et al. 2009, Zhang et al. 2020, Niţă and Borz 2023). Among the factors related to the forest wood supply chain, quality and quantity estimation of logs remains one of the most important elements. These parameters provide important and necessary details for all actors along the forest-wood supply chain – from harvesting to the timber industries – and are the basis for value creation (Borz and Proto 2022). Therefore, the assessment of roundwood quality and quantity, and consequently the ability to forecast product outputs, is of vital importance to these sectors (Fonseca 2005). This is particularly relevant in cases where timber is sold at the forest roadside, where accurate stack volume measurement directly influences pricing negotiations and economic decisions (Purfürst et al. 2023). The accurate estimation of the volume of roundwood is of great importance for the timber supply chain. This includes cost management and other operational factors that are important for forest owners and managers, companies harvesting timber, those transporting the product, end consumers, and wood-processing companies (Moskalik et al. 2022).
There are typically two ways of assessing the volume of roundwood: (1) the weight method and (2) the volumetric measurement method (de Miguel-Díez et al. 2023). The latter can be applied per log, per stack, or per truck. Volumetric measurements are widely used in Europe (Tomczak et al. 2025). Several studies have focused on comparing the benefits and limitations of various volumetric assessments, often revealing uncertainties in these methods (Momo et al. 2018, Müller et al. 2019, Gergeľ et al. 2022). In contrast, weight measurements are usually more accurate, even in specific situations when crane scales are used (Starke and Geiger 2022). Some disadvantages include the challenge of log weighing in the forest, where most of the raw material is sourced. This is due to the unavailability of weighbridges and because the weight varies significantly due to changes in timber moisture content across different seasons, and because of drying between the point of log production in the forest and production in the mill. On the other hand, with the help of the volumetric method, it becomes possible to calculate with higher accuracy at a given cost for the industrial roundwood (de Miguel-Díez et al. 2023).
In many countries, manual methods are still widely used for the volumetric measurement of individual logs and stacks. The reliability of some of these methods is not so high, and the measured data varies from operator to operator. In addition, data collection by manual methods is not reproducible, it is time- and labour-intensive, and inefficient in most cases (Pásztory et al. 2018). Therefore, integrated methods have been developed to measure the wood volume, depending on the technical possibilities (Yu et al. 2023). Over recent decades, various methods, such as opto-electronic measurement devices (Sladek and Neruda 2007), the photo-optical measurement method (Berendt et al. 2021), the handheld LiDAR-based measurement method, as well as iPad-LiDAR (Purfürst et al. 2023), and even smartphones (Kärhä et al. 2019), have been developed for roundwood measurement and grading (de Miguel-Díez et al. 2022).
Value creation is closely linked to optimal bucking (Erber et al. 2021), which maximises the value of a tree by properly segmenting the stem into assortments (Labelle and Huß 2018). Timber assortments are made up of stem sections with defined dimensions and quality, which are indicators of the timber value and application. A proper evaluation of timber assortments is thus critical for effective forest management (Marchi et al. 2018), specifically to help forest owners in the management of their harvest operations, the development of the forest wood supply chain, as well as the advancement of strategic forest management (White et al. 2014, Alvites et al. 2022).
The actual amount of wood is measured as cubic metres of solid wood and is usually estimated under bark (u.b.) (de Miguel-Díez et al. 2023). In some countries, such as Finland (Haapanen et al. 2016), this variable can also be measured over bark (o.b.). The solid wood content does not correspond to the stacked volume as timber stack includes wood, bark, and the spaces between logs, which are commonly referred to as cavities, gaps, or cracks (Smith 1979). Such gaps can be filled with air or materials like soil, snow, ice, branches, leaves, and stones. Therefore, the ratio of the solid wood fluctuates generally between 60% and 70%, influenced by (i) the tree species, (ii) the quality of timber assortment, (iii) the length of logs, (iv) the diameter of the logs, and (v) the experience of workers stacking the logs. For industrial or low-quality assortments, this ratio can be lower than 45%, and in exceptional cases, especially for high-quality, uniformly shaped sawlogs, it can be 80% or more (Fonseca 2005, de Miguel-Díez et al. 2023). Consequently, this variation in the gross volume of wood stacks significantly affects the economic value of stacks. It is common to convert the gross stack volume to a net volume by using an appropriate conversion factor (Câmpu et al. 2015). An example of a conversion factor for 3 m long logs is 0.6, meaning that one gross stacked cubic metre over bark is equivalent to 0.6 cubic metres of solid wood under bark (DFWR and DHWR 2020). However, it has been shown that sweep and log length in particular have a strong influence on the conversion factors and that they should be adapted to the specific characteristics of the stacks (de Miguel-Díez et al. 2023).
The objectives of this study were to:
compare the measurement systems on a one-to-one basis, i.e., to compare the harvester measurement with the opto-electronic measurement at the sawmill
compare the German manual sectional volumetric measurement method according to the Framework agreement for the trade in raw timber in Germany (Rahmenvereinbarung für den Rohholzhandel in Deutschland, RVR) with an adapted sectional volumetric measurement method used in practice (RVRprxis), and an app-based photo-optical system
compare the manual sectional volumetric measurement method with an electronic measurement system for truck loads for industrial timber assortments
derive conversion factors for converting the gross volumes of timber stacks to the volume of solid wood under bark.
2. Materials and Methods
2.1 Study Area
Harvesting was carried out in July 2021 using a John Deere 1170G harvester with an H414 harvester head and a John Deere 1110E forwarder. The forest stands dominated by Scots pine (Pinus sylvestris L.) were located in the administrative district of Prignitz, north-east Germany, in the area of Gadow (53.08080, 11.62452). An experienced data collector applied all manual and photo-optical measurement methods consistently throughout the study to reduce human influence on volume assessment.
The harvester felled and processed trees from eleven demarcated forest stands with areas ranging from 1.56 to 6.21 ha (Table 1). The logs were extracted by the forwarder to the landing site. A distinct landing site was dedicated for each plot (Fig. 1). The felled trees were bucked into different assortments: The timber of highest quality, destined for sawmills, was divided into assortments of 3 m and 5 m (LAS 3 m; LAS 5 m) with diameters between 14 and 55 cm. The timber of lower quality, exhibiting greater numbers of knots and higher degrees of crookedness, was sold to a pallet and packaging producer with an assortment length of 2.40 m (LAK) and diameters of 12–55 cm. Industrial wood assortments were generally of low quality and/or had smaller top-end diameters. These were destined for the oriented strand board (OSB) or medium-density fibreboard (MDF) industry, both with a log length of 3 m. The sorting decision for OSB timber was primarily based on diameter, the knot numbers and/or knot sizes, while for MDF timber, beginning rot and strong crookedness were also considered. The diameters of the OSB logs were 7–55 cm, while those of the MDF logs were 6–80 cm.
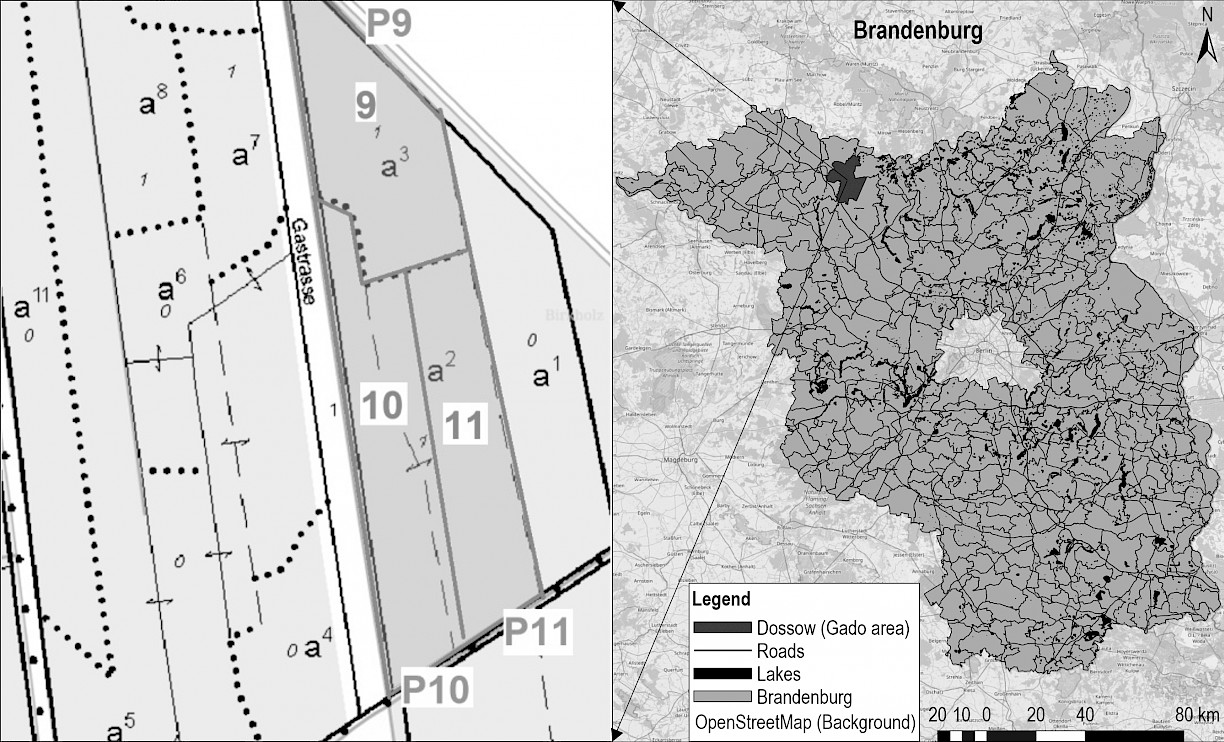
Fig. 1 Study area in Brandenburg, Germany, showing as an example for three plots (9, 10, 11) the dedicated landing site (P9, P10, P11)
Table 1 Main characteristics of the study sites
|
Forest plot |
P1 |
P2 |
P3 |
P4 |
P5 |
P6 |
P7 |
P8 |
P9 |
P10 |
P11 |
|
Stand area, ha |
6.21 |
3.12 |
3.44 |
4.56 |
2.33 |
1.58 |
4.15 |
4.36 |
1.83 |
1.93 |
1.56 |
|
Average stand age, years |
83 |
83 |
83 |
69 |
69 |
69 |
62 |
62 |
35 |
112 |
112 |
2.2 Measurement Methods
Opto-electronic devices (e.g., frame-based laser scanners such as RemaSawco RS-LogScanner3D, Microtec LogEye, or Jörg Elektronik JORO-3D) are commonly used at sawmills to measure individual logs following the debarking of stem wood. In contrast, industrial roundwood, for example, that which is destined for MDF or OSB, is typically measured in stacks at the forest roadside.
In this study, each stack was measured individually. Subsequently, the volumes of all stacks were quantified through two manual and one photo-optical measurement technique at the roadside. At the sawmill, the LAS and LAK assortments (comprising 12 stacks of LAS 5 m, 8 stacks of LAS 3 m, and 12 stacks of LAK) were measured individually using an opto-electronic log measurement system. These systems, commonly used in sawmills, utilise laser-based profile scanners to capture the diameter, length, and shape of each debarked log with high precision, following standard protocols for calculating volume. Therefore, the two LAS assortments were measured on a different device compared to the LAK assortment. The industrial wood assortments intended for the production of OSB (11 stacks) and MDF (13 stacks) were measured in volume.
Table 2 The main characteristics of log measurement methods used in this study
|
Harvester log measurement (harvester) Opto-electronic log measurement (sawmill) |
Truck load scanning (truck scanning) |
Manual sectional volumetric measuring method for stacks (RVR) Adapted sectional volumetric measuring method for stacks (RVRprxis) Photo-optical stack measurement (FOVEA) |
|
|
Assortments measured |
LAS 3 m, LAS 5 m, LAK |
MDF, OSB |
All |
|
Number of stacks measured |
32 |
24 |
56 |
|
Measurement unit |
m³ u.b. |
m3 o.b., stacked |
m3 o.b., stacked |
Harvester log measurement (harvester): In fully mechanised forestry operations, the functions of a harvester head include felling, delimbing, diameter and length measurement, and bucking (Miettinen et al. 2009). When processing felled trees, the harvester records the volume of each delimbed log. Volume calculation is based on the length measured by the measuring wheel of the harvester head and the log centre diameter measured by the position of feed rollers or by the opening angle of the delimbing knives. With these measurements and the application of conventional formulae, the volume of the logs can be calculated (Pásztory et al. 2018). Accuracy in estimating length and diameter is therefore crucial. In addition, the volume derived from this method can be used as a benchmark for opto-electronic measurements in the sawmill (Hohmann et al. 2017). Calibration of the harvester head was carried out daily in accordance with current practice in the harvesting company and the guidelines published by the KWF e.V. (KWF 2010). The unit of volume recorded by the harvester in the presented research was cubic metres under bark (m³ u.b.). As the diameter is measured over bark, the harvester on-board unit automatically applied the bark reduction factors from the RVR (DFWR and DHWR 2020)
Opto-electronic log measurement (sawmill): One-by-one measurement, commonly used at the infeed of sawmills, is often considered the most accurate wood measurement technology (Knyaz and Maksimov 2014). These systems scan the shape of the logs and estimate diameter, length, sweep, and taper with high accuracy. Volume (in cubic metres under bark (m³ u.b.)) is measured after mechanical debarking of the logs
Manual sectional volumetric measuring method for stacks (RVR): This method, which meets the legal requirements for official invoicing in Germany, is described in the German Timber Trade Framework Agreement (RVR) (DFWR and DHWR 2020). The volume of the stack is estimated by multiplying the calculated front and rear surface areas by the length of the logs (Cremer et al. 2020, Berendt et al. 2021). The resulting volume is the gross cubic metre over bark (m3 o.b., stacked), which includes bark, air space, and varying proportions of foreign matter (Smith 1979, Ministry of Natural Resources and Forestry 2017)
Adapted sectional volumetric measuring method for stacks (RVRprxis): In forestry practice, a modified version of the RVR is often preferred because it is simple and quick to use. For example, instead of measuring the height in the centre of each section, an average height is taken from the heights to the left and right of the centre of the section. Heights are measured with a 5 cm resolution, and all values are systematically rounded down to the nearest 5 cm. The resulting volume is the gross stacked cubic metre over bark (m3 o.b., stacked) (Arndt 2022)
Photo-optical stack measurement (FOVEA): The app iFovea v 2.5 (palos GmbH, Salzburg, Austria) (Fig. 2) was employed for the photo-optical stack volume measurement. To ascertain the volume of stacks, the operator must take photographs of the stack front surface in accordance with the instructions provided by the app (SDP Digitale Produkte GmbH 2020), which are then automatically stitched together by the app. In the event of larger stacks, a panorama image comprising a maximum of 35 photos can be created. The stack contour is automatically defined and post-processed to create an accurate contour definition. The app utilises the manually measured length of the stack (left to right, fig. 2) as a spatial reference for calculating the stack front surface area. Finally, the depth of the stack, corresponding to the log length, is manually entered to calculate the gross volume in cubic metres stacked over bark (m3 o.b., stacked), which includes air spaces between the logs.
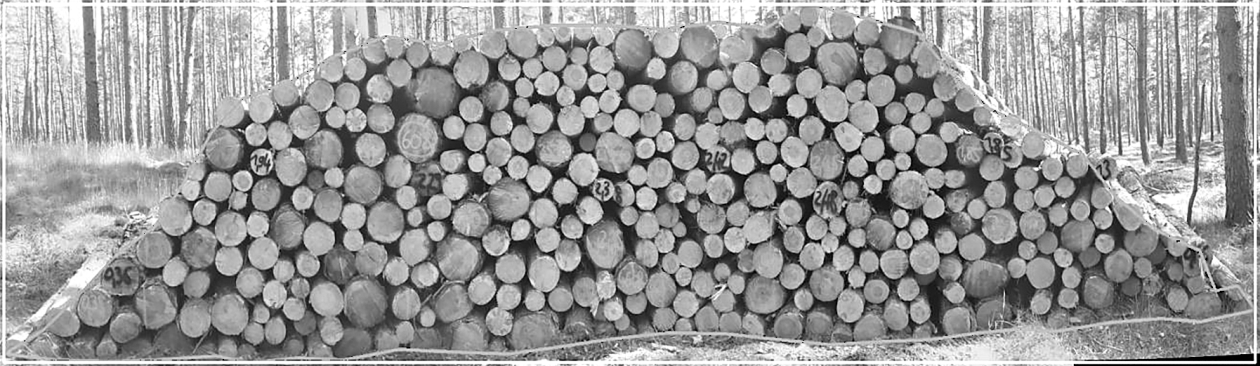
Fig. 2 A wood stack recorded using photo-optical stack measurement application iFovea
Truck load scanning (truck scanning): Laser scanning technology was employed to estimate the volume of the truck load. The trucks are directed through a portal (Fig. 3) at a maximum speed of 5.0 km/h, while lasers scan the entire truck load. The software (JORO-volume) analyses the resulting laser-generated scan data to distinguish the roundwood from the truck and computes the gross volume of the load in cubic metres stacked over bark (m3 o.b., stacked), including the air spaces within the stack.

Fig. 3 Truck load scanning portal
2.3 Statistical Analysis
The initial data were recorded in standard spreadsheets and prepared for further processing. Outliers were identified through visual inspection of boxplots. These data points were considered anomalies, as measurement errors could not be excluded, and were therefore excluded prior to analysis to prevent distortion of the statistical results. Specifically, in the LAS 5 m, one stack each for RVR, RVRprxis, and FOVEA was identified as an outlier. In the MDF assortment, two outlier values were identified: one for RVR and one for FOVEA. Furthermore, an outlier value was identified for RVRprxis in the LAK assortment in section 3.1. In all other instances, the original datasets were utilised. Subsequently, a one-way analysis of variance (ANOVA) was conducted in Python (within the Jupyter Notebook environment) using the Statsmodels library to examine potential differences between methods at a 0.05 probability level. In addition, the Pandas, Matplotlib, and SciPy libraries were employed to manipulate data and generate visual charts.
3. Results
3.1 Comparison of Stack Measurement Methods for Different Assortments
Overall, and considering the RVR wood stack measurement method, stacks of the timber assortment LAS 5 m showed the highest mean gross volumes with 81.9832.93 m3 o.b., stacked, followed by the timber assortments MDF (72.3034.09 m3 o.b., stacked), LAK (68.4442.18 m3 o.b., stacked), LAS 3 m (56.7027.37 m3 o.b., stacked), and OSB (47.3033.05 m3 o.b., stacked). The differences in the average volume of the stacks per assortment were proven to be statistically significant (Fig. 4).
Furthermore, the volume of each timber assortment was evaluated using three different methods (RVR, RVRprxis, and FOVEA). For each assortment, the results of the statistical analyses, including parametric tests such as ANOVA and Welch's ANOVA, as well as the non-parametric Kruskal-Wallis test, indicated that there were no significant differences among the three methods (Fig. 4). This may also be due to the sample size and standard deviation of the variables. In addition, the accuracy of the other two methods (RVRprxis and FOVEA) may also play a role in these results.
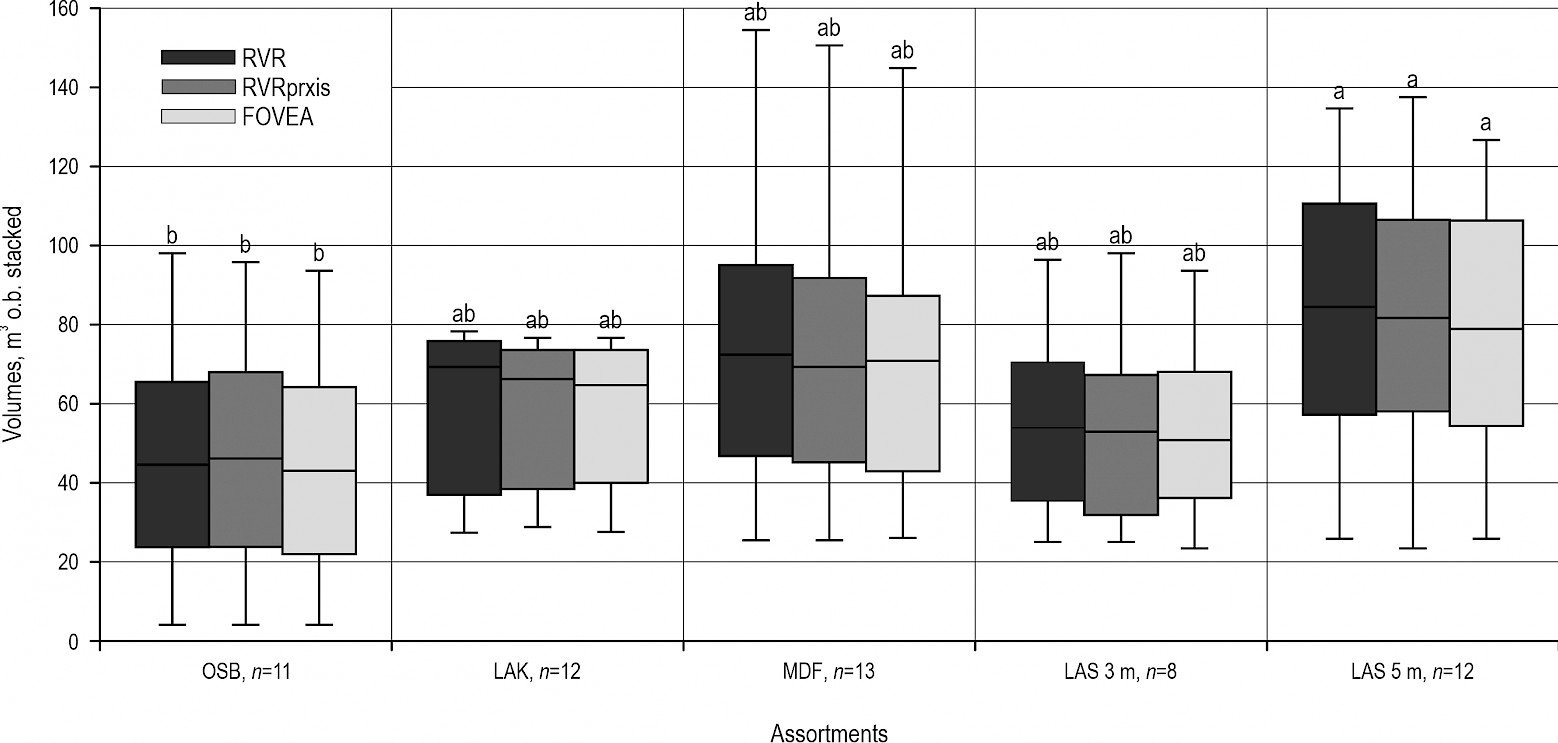
Fig. 4 Arithmetic mean (number) and median (horizontal line within boxes) of the gross stacked volume o.b. (m³o.b., stacked) for different measurement methods and different timber assortments (for each method, means with different letters have a significant difference)
A comparison of the stack measurement methods revealed that the greatest relative difference in the mean gross volume of stacks was observed between RVRprxis and FOVEA for the OSB assortment (5.41%). Conversely, the smallest difference in volume was recorded between RVRprxis and FOVEA for the LAS 3 m assortment (0.46%). Concurrently, an examination of the various assortments revealed a considerable disparity in the volumes assessed by the distinct measurement methods, with a range of 3.28% to 5.41% for OSB (4.39%). Small volume differences were recorded for LAS 3 m (0.87%), with a range of between 0.46% and 1.40%. The results also demonstrated that, in total, the average deviation between RVR and FOVEA (3.16) was higher than that between RVR and RVRprxis (2.07), as well as between RVRprxis and FOVEA (2.37%) (Table 3).
Table 3 Difference (%) in mean gross volume (m³o.b., stacked) of stacks among different stack measurement methods and for various assortments
|
Assortment |
RVR vs RVRprxis, % |
RVR vs FOVEA, % |
RVRprxis vs FOVEA, % |
|
MDF |
2.34 |
4.86 |
4.74 |
|
OSB |
3.28 |
4.49 |
5.41 |
|
LAK |
1.27 |
1.92 |
0.64 |
|
LAS 3 m |
0.74 |
1.40 |
0.46 |
|
LAS 5 m |
2.49 |
3.11 |
0.59 |
|
Average deviation, % |
2.02 |
3.16 |
2.37 |
3.2 Comparison of Harvester and Sawmill Measurement Methods for Different Assortments
A comparison of the solid timber volumes was carried out based on the deviation of the harvester measurement from the sawmill measurement. This was done to examine the differences across LAK, LAS 3 m, and LAS 5 m assortments (Fig. 5). Results showed that in LAS 3 m and LAS 5 m, the harvester method underestimated the volume. The greatest relative difference in volume assessed by harvester and sawmill methods was observed for LAS 5 m (–2.19%4.67), followed by LAS 3 m (–1.67%3.79), and LAK (0.75%5.95) (Fig. 5).
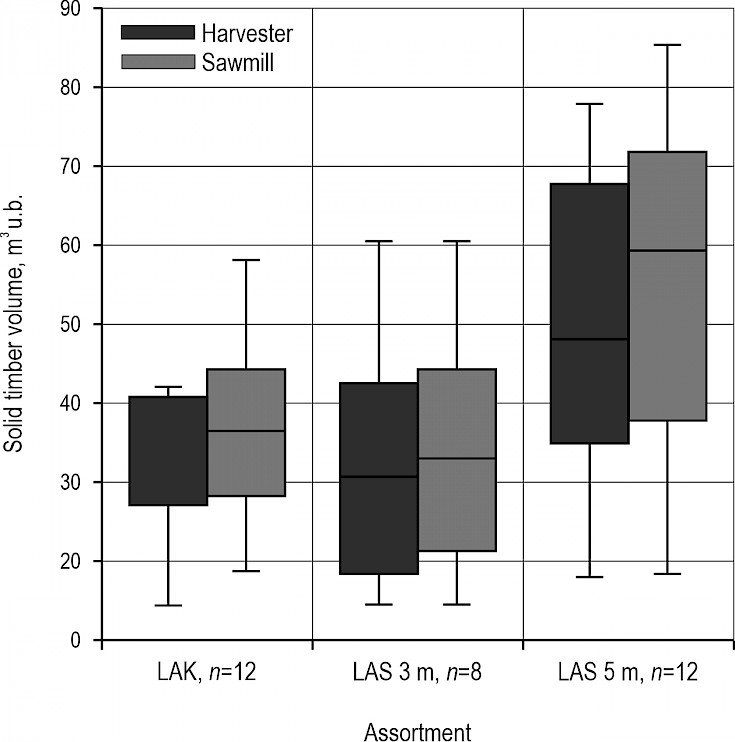
Fig. 5 Boxplot of solid timber volumes under bark (m3 u.b) assessed by harvester (black) and sawmill (dark grey) methods
3.3 Comparison of Stack Measurement Methods (RVR and Truck Scanning) for OSB and MDF
The results for MDF indicate that in the majority of cases (77%), the gross volume of RVR surpasses that of the timber truck gate (Fig. 6 and 7). On average, the RVR volume was 3.41±6.71 m3 o.b., stacked (3.51%) higher than the truck scanning volume (Table 4).
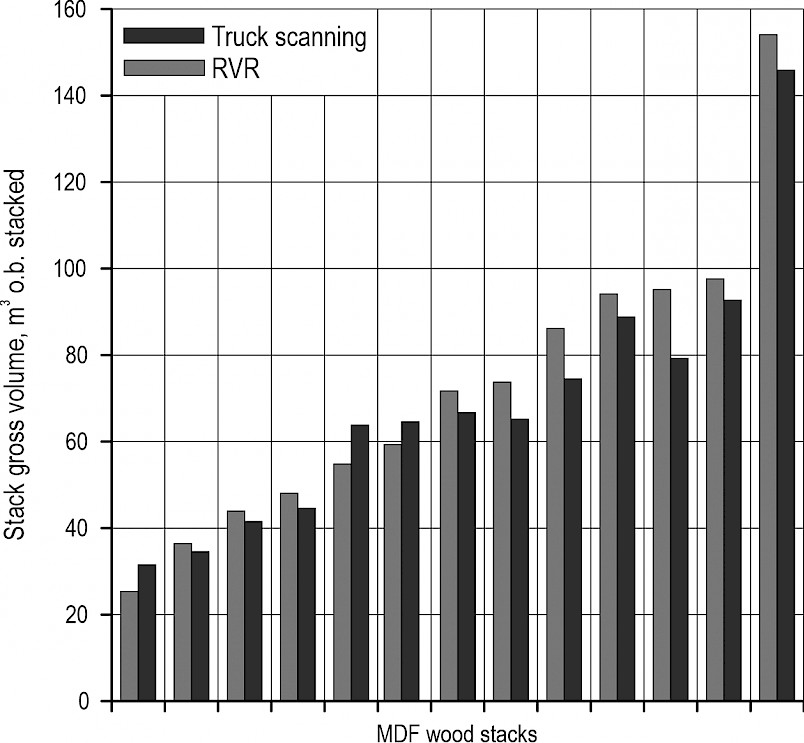
Fig. 6 Comparison of stack gross volume (m³o.b., stacked) for MDF by RVR and truck scanning
In a manner analogous to MDF, the volumes of the OSB assortment assessed by RVR were, in the majority of cases (91%), higher than those assessed by truck scanning. On average, the volumes by RVR were 3.56±5.09 m3 o.b., stacked (6.42%) higher (Table 4).
The results pertaining to OSB indicated that, when examining small stacks, the volumes of RVR and truck scanning were comparable. However, for larger stacks of MDF and OSB, there was an increasing discrepancy between the two methods, with RVR recording significantly higher volumes than truck scanning. In numerical terms, this means that for wood stacks smaller than 50 m3 o.b., stacked, the difference between the truck scanning and RVR measurements was –0.88% and 2.20% for MDF (n=4) and OSB (n=6), respectively. For stacks larger than 50 m³ o.b., stacked, the volumes measured by timber truck gate were 5.47% and 11.47% lower than those measured by the RVR method for MDF (n=9) and OSB (n=5), respectively (Fig. 6 and Fig. 7).
Furthermore, the results indicated that there was a statistically significant difference between the volumes measured by RVR and those measured by truck scanning in the OSB assortment (p-value=0.04). In the MDF assortment, however, no significant difference was observed at the 0.05 probability level (p-value=0.09) (Table 4).
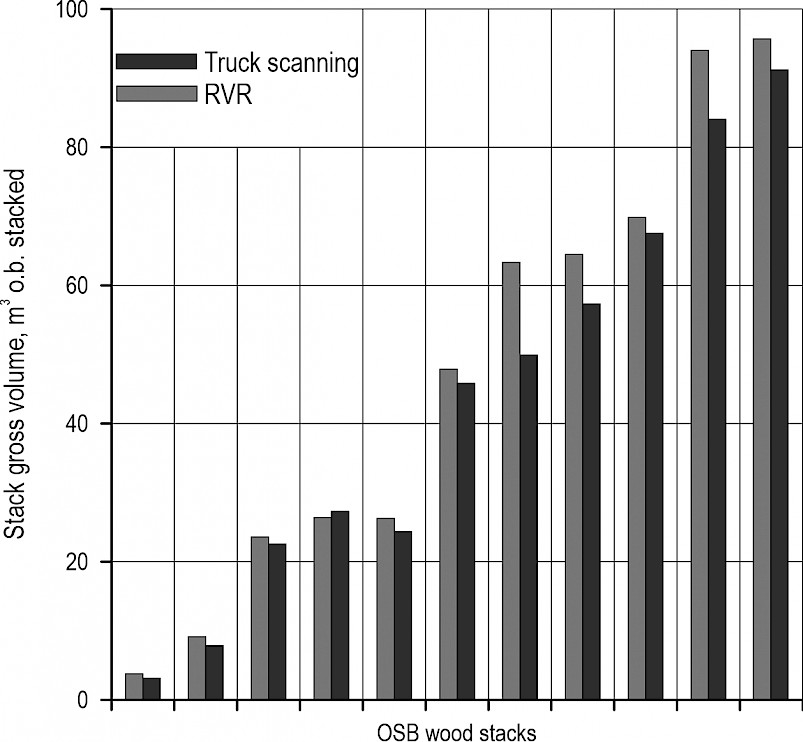
Fig. 7 Comparison of stack gross volume (m³o.b., stacked) for OSB stacks by RVR and truck scanning
Table 4 A statistics summary, and paired t-test p-values between volume measurements in OSB and MDF assortments by RVR and truck scanning
|
Assortments |
Mean of difference, % |
Minimum difference, % |
Maximum difference, % |
SD of difference |
P-Value, t-test |
|
OSB, difference |
6.42 |
–3.64 |
26.63 |
5.09 |
0.04 |
|
OSB, absolute difference |
7.08 |
1.20 |
26.63 |
4.96 |
0.04 |
|
MDF, difference |
3.51 |
–21.34 |
19.48 |
6.71 |
0.09 |
|
MDF, absolute difference |
9.39 |
3.44 |
21.34 |
4.06 |
0.09 |
3.4 Conversion Factors for Different Timber Assortments
In this study, the conversion factors were calculated with the use of the solid wood volumes under bark divided by gross stacked volumes over bark and air spaces. Furthermore, the conversion factors were evaluated based on the sawmill and harvester measurements, giving timber volume under bark. Both of these were divided by the manual sectional gross volume estimated by the RVR method. The results of the statistical analysis indicated a significant difference between the conversion factors derived from the harvester and sawmill measurements for LAS 3 and 5 m. However, no significant difference was observed for LAK (Fig. 8). The average conversion factor across all three timber assortments was 0.58 for the harvester, and 0.61 for the sawmill measurements, respectively. The highest conversion factor using the harvester measurement was observed for LAK (0.66), and the lowest was recorded for LAS 3 m (0.50). It was also evident that in all assortments, the conversion factor based on the harvester was lower than the sawmill measurement (Fig. 8).

Fig. 8 Conversion factors from gross volume stacked into solid wood volume using RVR and harvester (dark grey) or sawmill (light grey) measurements for three timber assortments: LAK, LAS 3 m, and LAS 5 m (for each assortment, means with different letters have a significant difference)
4. Discussion
4.1 Stack Measurements
In this study, the volumes of wood stacks have been compared by the RVR and RVRprxis methods, as well as the FOVEA system for different assortments located in the northern part of Brandenburg, Germany. Our findings demonstrated that the use of RVR, RVRprxis, and FOVEA for the assortments resulted in no significant differences in volumes (Fig. 4).
This suggests that the accuracy of these methods can be deemed acceptable on average, although in single cases the deviation can be quite high. The comparability of these methods is not necessarily dependent on the measuring system, but could also be influenced by external factors such as the operator, wood species, and the size of the wood stack. The results of our investigations were consistent with Purfürst et al. (2023). They indicated that each of the used methods was appropriate for assessing the total volumes of the stacks. Nevertheless, they reported that there was a significant difference among the various methods. For instance, in their study, the percentage of difference between the manual method based on RVR and FOVEA was 5.90%. In the present study, the maximum difference between RVR and FOVEA was 4.86% (in MDF), while the maximum difference between RVRprxis and FOVEA was 5.41% (Fig. 4 and Table 3). However, Berendt et al. (2021) showed that the photo-optical gross volume estimate deviated from the manual estimate by an average of –2.09% for RVRleft and –3.66% for RVRright, with a deviation of 2.54% between RVRleft and RVRright. It is important to note that in the mentioned study, the stacks included industrial wood assortments of broadleaved species, mainly European beech (Fagus sylvatica L.) and European ash (Fraxinus excelsior L.), or a mixture of them. In another investigation, Tomczak et al. (2024) reported that a significant difference existed between manual section-wise stack volume estimations and photo-optical methods, including iFovea, Timbeter, and LogStackPro. They also noted that the variance between methods was substantial.
4.2 Log Measurements
In the present study, only the front side of the stacks was measured in all methods, while the RVR method requires a measurement of both sides of the stack and calculates based on their average. Therefore, as an unobstructed view and access are needed, photo-optical systems frequently face limitations when measuring the backside of the stack. A large-scale comparison of the difference in accuracy between measuring only the log stack front side and measuring both the front and back sides of the log stack is desirable. The various measurement methods applied for wood stacks have been designed to best meet the specific criteria. These methods were required to demonstrate a high level of efficiency while ensuring the utmost accuracy. The recorded measurement values must be comprehensible and verifiable by all individuals engaged in timber processing and sales. Furthermore, the process of timber harvesting, skidding, and transportation should remain uninterrupted by data collection, and costs should be minimised wherever feasible (Pásztory et al. 2018).
Generally, the objective of the sawmilling industry is to procure the best raw materials efficiently and sustainably, at the lowest possible cost. This necessitates ensuring that the logs quality and length-diameter distribution align with product specifications. In practical terms, the raw materials should originate from stands that are capable of yielding the desired quality, and the trees must be cut into pieces based on specific requirements. Consequently, the objective of the user is to enhance the net revenue derived from wood-based products by maximising the added value of purchased raw wood materials (Malinen et al. 2006). The present study examined harvester measurement systems and the measurement of logs at the sawmill with the objective of evaluating the solid timber volume of logs for the sawmilling industry. The results demonstrated differences of 0.75%, –1.67%, and –2.19% between the harvester and the sawmill measurements based on the sawmilling system for LAK, LAS 3 m, and LAS 5 m, respectively. One of the primary contributors to this variation can be attributed to the conditions under which timber harvesting takes place. For example, although the calibration of the devices used in the harvester and sawmill was up to date and performed regularly, minor deviations in recorded timber size may still occur due to leeways, environmental factors, or mechanical variations. Furthermore, it is important to highlight that the harvester measurement was conducted over bark and that the defined bark factors were subsequently applied to the measured diameter to calculate the log volume without bark, acknowledging that bark thickness varies between logs and tree origin. In comparison, sawmill measurements were carried out after mechanical debarking and are therefore not affected by assumptions regarding bark thickness. To improve harvester measurement, adapted bark deduction factors or models should be developed and implemented (Strandgard and Walsh 2011, Sedmíková et al. 2020), especially for Scots pine with its varying bark thickness across different stem segments (Wilms et al. 2021).
The accuracy of these two methods has been tested in several studies. For instance, Hohmann et al. (2017) reported on the accuracy of the manual measurement of single logs (which was not tested in this study) and evaluated the harvester measuring system by comparing the calculated volume with the real volume estimated by the water immersion technique. It is concluded from their results that the trunk values obtained with the harvester measuring system give a better estimation of the actual volume of the trunk in comparison to the manual estimation. Furthermore, Löwe et al. (2019) reported that there was a significant difference in the log volumes estimated by various algorithms employed in the control and information systems of harvesters. To ensure dependable results from harvesters, it is essential to conduct routine inspections of the harvester measuring systems. Nevertheless, considerable variation, particularly in length measurements, can still occur (Hannaske 2016). It is recommended that regular calibration of the harvester measuring unit be carried out (Sedmíková et al. 2020) in order to facilitate the further use of information provided by harvesters along the supply chain. However, to date, these measuring systems have been employed solely as a source for reference dimensions and as a control measure. Despite the advanced nature of this technology, due to regulatory obligations, it lacks credibility in Germany and various other European countries. At present, for commercial transactions in German forestry, only certified opto-electronic measuring devices installed at the entry points of sawmills are considered valid (Hohmann et al. 2017).
In contrast, in typical timber procurement practices in Finland, foresters commonly utilise a measurement system that integrates both the sawmill and harvester. In the first step, the harvester measures the timber, and in the next step, the measurement is repeated at the sawmill. However, the sawmill measurement technology is more precise and consequently more reliable. Therefore, the harvester data can be matched using this method, resulting in deviations of ±4%, which is in accordance with Finnish standards (Kärhä et al. 2019). Harvester measurement systems are not calibratable according to the National Metrology Institute of Germany (PTB, Physikalisch-Technische Bundesanstalt) and, thus, do not fulfill the legal requirements for sales purposes and the calculation of bills in Germany. Timber measurement systems that are enabled for the German calibration should ensure the reproducibility and repeatability of measurement results as well as avoid all possible manipulations of data and results. However, as shown by a Swedish study, the use of harvester measuring data within the timber supply chain may result in:
more efficient resource use due to increased incentives for the purchaser to preserve the value created and improved control of the supply chain
a simpler price list which improves the supplier relationships and increases transparency, and
"because of the expanded supply chain surplus and decreased total costs, forest industries might raise the level of their profitability and competitiveness" (Eriksson et al. 2023).
4.3 Truck Scanning
A straightforward comparison between RVR and truck load scanning in truck scanning for MDF and OSB revealed that in the majority of cases (76.92% and 63.63% of total stacks for MDF and OSB, respectively), the value for RVR was higher than that for truck scanning. Furthermore, Fig. 6 and Fig. 7 illustrate notable variations in volume for certain stacks, with percentages of 26.63% and 15.90% for OSB and 16.31% and 13.01% for MDF. The investigation was conducted in authentic, real-world conditions, ensuring that the quality of log stacks accurately reflected a typical state. Therefore, in addition to potential discrepancies resulting from the precision of the measurement method, this disparity may also be attributed to the fact that larger stacks were transported in several different truck loads, where some logs were part of a non-measured distinct truck load or remained in the forest. This scenario is applicable when the RVR exceeds that of the timber truck load (Acuna and Sosa 2019). Thus, the higher discrepancy with increasing stack volume could also result from reduced air space within the truck load when compared to stacks on forest roads. This could explain the higher volume difference observed for OSB. The superior log quality, which is characterised by fewer sweep logs, facilitates more efficient stacking and minimises air space in the truck load. As was shown, the difference between various measurement techniques is highly related to the quality of log stacks. A similar conclusion was derived from an earlier study (Berendt et al. 2021), which revealed that as the quality of log stacks diminished, there was a corresponding increase in the range of deviations. To minimise the effect of bark damage and losses related to log manipulation during loading and unloading, the time span between harvest and haulage has to be kept very short. However, some small differences in gross volume might also be caused by differences in the amount of bark.
4.4 Conversion Factors
The conversion factor shows the relationship between gross volume with bark (the estimated stack) and the actual wood content in solid form. In this study, the mean conversion factor using harvester measurement ranged from 0.57 when considering the LAS 5 m to 0.59 when considering the LAK, and when using sawmill measurement, it ranged from 0.59 when considering the LAS 5 m to 0.62 when considering the LAS 3 m and LAK. Additionally, the harvester measurement was found to be significantly higher than the sawmill measurement in both the LAS 5 m and LAS 3 m. Moreover, the greatest degree of variability in the conversion factor was observed in LAS 3 m (Fig. 8). The ratio between these elements within the stack typically varies within a range of 0.50 to 0.80. However, statistically, the conversion factor, calculated as the ratio of solid wood volume under bark to gross stacked volume over bark, including air spaces, must fall between 0 and 1, as the numerator represents a subset of the total volume measured (Pásztory et al. 2018). A greater value represents a higher portion of solid wood content in a cubic metre of stacked material. This result is consistent with the standard conversion factor proposed in the RVR document of 0.60 for logs with a length of 3 m (DFWR and DHWR 2020). Van Laar and Akça (2007) proposed a conversion factor of 0.80 for pulpwood under bark (with smaller dimensions of the logs and considerably higher pack size) and a conversion factor of 0.70 for firewood over bark.
The variables affecting the conversion factor can be categorised into three main groups. Firstly, it is necessary to consider the log parameters, which include midpoint diameter, log length, log preparation, sweep, taper, ovality, bark presence, bark thickness, and quality of delimbing. Some factors, like taper and sweep, generally affect the volume of stacks to a substantial degree (de Miguel-Díez et al. 2021). Secondly, stack parameters play a significant role. These encompass stacking quality, stacking method, re-stacking, the percentage of butt logs in the stack, the proportion of stacked logs in different directions, stack height, and the percentage of tapered and crooked logs in a stack. Eventually, external variables such as the time, the proportion of snow and ice in the winter, the presence of unwanted materials like foreign matter and waste, and the water percentage, also contribute to the overall impact on the conversion factor (de Miguel-Díez et al. 2023). Consequently, the conversion factor derived in our study should be regarded as a provisional estimate that must be adjusted to reflect changes in the characteristics of the stack or log.
Furthermore, the mean conversion factor was observed to decrease with an increase in the length of the timber assortment. This phenomenon may be attributed to a number of factors that are mostly less pronounced in shorter logs, including taper, the presence of buttresses on butt logs, sweep, and higher occurrence of crossed logs when they are longer. The influence of log length on the conversion factors has been consistently emphasised in numerous studies, with all of them reporting similar results. For example, Jodłowski and Witkowska (2019) estimated the conversion factors for stacked pine and spruce logs in the range of 3 to 6 m. They reported that in their study, there was a negative correlation between the length of logs and the conversion factor. Furthermore, Câmpu (2012) examined two and three-metre stacked wood, particularly spruce pulpwood and firewood, and reported that the conversion factor of the stacked wood is significantly affected by variables such as the wood length and diameter, the presence of form defects, and the arrangement of the wood. The impact of timber assortment length is notable, as shorter logs tend to pack more tightly. Consequently, the impact of this factor arises from factors such as sweep, taper, or protruding branch stubs, which result in the formation of larger voids in the stacks as the log length increases. This is because the effect of log length becomes more pronounced with increasing log size (de Miguel-Díez et al. 2023).
5. Conclusions
This study provides a comprehensive comparison of various log and wood stack volume measurement methods, focusing on Scots pine. The findings reveal that, while there are no significant differences in accuracy between RVR, RVRprxis, and FOVEA, further research is essential to understand the influence factors for log stack measurement and to compare the accuracy of stack volume assessment using only front area measurements versus both front and back area measurements. Our results indicate that harvester volume assessments tend to underestimate harvested volume across all assortments. Therefore, volume measurement at the saw mill remains the preferred method. However, harvester volume estimates are still adequate for planning supply chain processes, and further efforts to improve their accuracy are warranted, particularly through more precise bark deduction models. Truck load scanning, although promising, has produced inconsistent results compared to the traditional and established manual sectional volumetric measuring method. Additionally, conversion factors between log stack volume and solid volume vary significantly with log quality and stack quality. This study suggests that stacks of short, high-quality logs tend to have higher conversion factors than those currently recommended by the RVR or reported in previous studies. Future research in real forest environments and using modelling methods is needed to support ongoing discussions at both the German and European levels. This will help in developing more accurate and reliable measurement methods that can be widely adopted in the forest industry.
Acknowledgments
Financial support by the Federal Ministry of Research, Technology and Space (BMFTR), Germany, for the REGULUS-project »ADAPT-Wald-Holz« (grant number: 033L301A) is gratefully acknowledged. We also thank the timber harvesting as well as the participating timber industries for sharing the timber measurement data.
Data Availability
The experimental data that support the findings of this study are available in the BonaRes repository site: https://doi.org/10.4228/zalf-k64y-vb13
6. References
Acuna, M., Sosa, A., 2019: Automated volumetric measurements of truckloads through multi-view photogrammetry and 3D reconstruction software. Croatian J. Forest Eng. 40(1): 151–162.
Alvites, C., Marchetti, M., Lasserre, B., Santopuoli, G., 2022: LiDAR as a tool for assessing timber assortments: A systematic literature review. Remote Sens. 14(18): 4466. https://doi.org/10.3390/rs14184466
Arndt, F., 2022: Vergleich von unterschiedlichen Rohholzvermessungsverfahren in Deutschland mit besonderer Berücksichtigung des Harvestermaßes [Comparison of different timber measurement methods in Germany, with special consideration of harvester measurement]. Bachelor's Thesis, Eberswalde University for Sustainable Development, Eberswalde, Germany.
Berendt, F., Wolfgramm, F., Cremer, T., 2021: Reliability of photo-optical measurements of log stack gross volume. Silva Fenn. 55(3): 10555. https://doi.org/10.14214/sf.10555
Borz, S.A., Proto, A.R., 2022: Application and accuracy of smart technologies for measurements of roundwood: Evaluation of time consumption and efficiency. Comput. Electron. Agric. 197(1): 106990. https://doi.org/10.1016/j.compag.2022.106990
Câmpu, V.R., 2012: Determination of the conversion factor of stacked wood in solid content at spruce pulpwood and firewood with the length of two and three meters. Bull. Transilv. Univ. Brasov. Ser. II: For. Wood Ind. Agric. Food Eng. 5(54): 31–36.
Câmpu, V.R., Dumitrache, R., Borz, S.A., Timofte, A.I., 2015: The impact of log length on the conversion factor of stacked wood to solid content. Wood Res. 60(3): 503–518.
Cremer, T., Berendt, F., Diez, F. de M., Wolfgramm, F., Blasko, L., 2021: Accuracy of photo-optical measurement of wood piles. Environ. Sci. Proc. 3(1): 90. https://doi.org/10.3390/iecf2020-08192
De Miguel-Díez, F., Purfürst, T., Acuna, M., Tolosana-Esteban, E., Cremer, T., 2023: Estimation of conversion factors for wood stacks in landings and their influencing parameters: a comprehensive literature review for America and Europe. Silva Fenn. 57(1): 22018. https://doi.org/10.14214/sf.22018
de Miguel-Díez, F., Reder, S., Wallor, E., Bahr, H., Blasko, L., Mund, J.P., Cremer, T., 2022: Further application of using a personal laser scanner and simultaneous localization and mapping technology to estimate the log's volume and its comparison with traditional methods. Int. J. Appl. Earth Obs. Geoinf. 109: 102779. https://doi.org/10.1016/j.jag.2022.102779
de Miguel-Díez, F., Tolosana-Esteban, E., Purfürst, T., Cremer, T., 2021: Analysis of the influence that parameters crookedness and taper have on stack volume by using a 3D-simulation model of wood stacks. Forests 12(2): 238. https://doi.org/10.3390/f12020238
DFWR and DHWR., 2020: Rahmenvereinbarung für den Rohholzhandel in Deutschland (RVR). [German framework agreement for timber trade]. 3rd edn. Fachagentur für Nachwachsende Rohstoffe e.V. (FNR), Gülzow-Prüzen, Germany.
Erber, G., Stelzer, S., Stampfer, K., 2021: Evaluation of a novel mobile device app for value-maximized bucking by chainsaw. Int. J. of For. Eng. 32(1): 63–73. https://doi.org/10.1080/14942119.2021.1927362
Eriksson, P., Roos, A., Mark-Herbert, C., 2023: The role of harvester measurement in the wood supply chain. Int. J. For. Eng. 34(2): 216–228. https://doi.org/10.1080/14942119.2022.2123668
FAO, 2020: Global Forest Resources Assessment. Main Report; Food and Agriculture Organization of the United Nations: Rome, Italy.
Fonseca, M.A., 2005: The Measurement of roundwood: methodologies and conversion ratios. CABI Publishing: 1–267.
Freyburger, C., Longuetaud, F., Mothe, F., Constant, T., Leban, J.M., 2009: Measuring wood density by means of X-ray computer tomography. Ann. For. Sci. 66: 804. https://doi.org/10.1051/forest/2009071
Gergel', T., Bucha, T., Gracovský, R., Chamula, M., Gejdoš, M., Veverka, P., 2022: Computed tomography as a tool for quantification and classification of roundwood—Case study. Forests 13(7): 1042. https://doi.org/10.3390/f13071042
Haapanen, M., Hynynen, J., Ruotsalainen, S., Kilpeläinen, M.L., 2016: Realised and projected gains in growth, quality and simulated yield of genetically improved Scots pine in southern Finland. Eur. J. For. Res. 135(6): 997–1009. https://doi.org/10.1007/s10341-016-0989-0
Hannaske, M., 2016: Messgenauigkeit und fehlergrenzen von kranvollerntern bei der sortierung ausgewählter baumarten in der praxis [Measurement accuracy and error limits of crane harvesters sorting selected species in practice]. Bachelor's Thesis, Eberswalde University for Sustainable Development, Eberswalde, Germany.
Hohmann, F., Ligocki, A., Frerichs, L., 2017: Harvester measuring system for trunk volume determination: Comparison with the real trunk volume and applicability in the forest industry. Bulletin of the Transilvania University of Brasov, Series II: Forestry, Wood Industry, Agricultural Food Engineering 10(59): 27–34.
Ingrao, C., Bacenetti, J., Bezama, A., Blok, V., Goglio, P., Koukios, E.G., Lindner, M., Nemecek, T., Siracusa, V., Zabaniotou, A., Huisingh, D., 2018: The potential roles of bio-economy in the transition to equitable, sustainable, post fossil-carbon societies: Findings from this virtual special issue. J. Clean. Prod. 204: 471–488. https://doi.org/10.1016/j.jclepro.2018.09.068
Jodłowski, K., Witkowska, J., 2019: Determination of conversion factors for pine and spruce logs in stacks. Forest Research Papers 80(3): 181–187. https://depot.ceon.pl/handle/123456789/18757
Kärhä, K., Nurmela, S., Karvonen, H., Kivinen, V.P., Melkas, T., Nieminen, M., 2019: Estimating the accuracy and time consumption of a mobile machine vision application in measuring timber stacks. Comput. Electron. Agric. 158(1): 167–182. https://doi.org/10.1016/j.compag.2019.01.040
Knyaz, V.A., Maksimov, A.A., 2014: Photogrammetric technique for timber stack volume control. The International Archives of the Photogrammetry, Remote Sensing and Spatial Information Sciences – ISPRS Archives XL–3: 157–162. https://doi.org/10.5194/isprsarchives-XL-3-157-2014
Kuratorium für Waldarbeit und Forsttechnik e.V. (KWF)., 2010: Lastenheft Harvestervermessung; KWF-Bericht Nr. 41; KWF: Groß-Umstadt, Germany.
Labelle, E., Huß, L., 2018: Creation of value through a harvester on-board bucking optimization system operated in a spruce stand. Silva Fenn. 52(3): 9947. https://doi.org/10.14214/sf.9947
Löwe, R., Sedmíková, M., Natov, P., Jankovský, M., Hejcmanová, P., Dvořák, J., 2019: Differences in timber volume estimates using various algorithms available in the control and information systems of harvesters. Forests 10(5): 388. https://doi.org/10.3390/f10050388
Malinen, J., Kilpeläinen, H., Wall, T., Verkasalo, E., 2006: Variation in the value recovery when bucking to alternative timber assortments and log dimensions. For. Stud. 45: 89–100.
Marchi, E., Chung, W., Visser, R., Abbas, D., Nordfell, T., Mederski, P.S., McEwan, A., Brink, M., Laschi, A., 2018: Sustainable Forest Operations (SFO): A new paradigm in a changing world and climate. Sci Total Environ. 634: 1385–97. https://doi.org/10.1016/j.scitotenv.2018.04.084
Miettinen, J., Helle, P., Nikula, A., Niemelä, P., 2009: Changes in landscape-scale habitat selection of capercaillie (Tetrao urogallus) in managed north-boreal forest. Silva Fenn. 43(4): 595–608. https://doi.org/10.14214/sf.182
Ministry of Natural Resources and Forestry, 2017: Scaling manual 4th edn., Peterborough, Canada.
Sagang, L.B.T., Momo Takoudjou, S., Libalah Bakonck, M., Rossi, V., Fonton, N., Mofack, G. II, Kamdem Guy, N., Nguetsop François, V., Sonké, B., Pierre, P., Barbier, N., 2018: Using volume-weighted average wood specific gravity of trees reduces bias in aboveground biomass predictions from forest volume data. For. Ecol. Manage. 424: 519–528. https://doi.org/10.1016/j.foreco.2018.04.054
Moskalik, T., Tymendorf, Ł., van der Saar, J., Trzciński, G., 2022: Methods of wood volume determining and its implications for forest transport. Sensors 22(16): 6028. https://doi.org/10.3390/s22166028
Müller, F., Jaeger, D., Hanewinkel, M., 2019: Digitization in wood supply–A review on how Industry 4.0 will change the forest value chain. Comput. Electron. Agric. 162: 206–218. https://doi.org/10.1016/j.compag.2019.04.002
Niţă, M.D., Borz, S.A., 2023: Accuracy of a Smartphone-based freeware solution and two shape reconstruction algorithms in log volume measurements. Comput. Electron. Agric. 205: 107653. https://doi.org/10.1016/j.compag.2023.107653
Pásztory, Z., Heinzmann, B., Barbu, M., 2018: Manual and automatic volume measuring methods for industrial timber. In Proceedings of the IOP Conference Series: Earth and Environmental Science; Institute of Physics Publishing: Bristol, UK, 159 p.
Purfürst, T., De Miguel-Díez, F., Berendt, F., Engler, B., Cremer, T., 2023: Comparison of wood stack volume determination between manual, photo-optical, iPad-LiDAR and handheld-LiDAR based measurement methods. iForest 16(4): 243–252. https://doi.org/10.3832/ifor4153-016
SDP Digitale Produkte GmbH, 2020: iFOVEA Pro. Available online: https://fovea.eu/ifovea_pro_woodpile_measurement?language=en (accessed 3 July 2024).
Sedmíková, M., Löwe, R., Jankovský, M., Natov, P., Linda, R., Dvořák, J., 2020: Estimation of over-and under-bark volume of scots pine timber produced by harvesters. Forests 11(6): 626. https://doi.org/10.3390/f11060626
Sladek, P., Neruda, J., 2007: Analysis of volume differences in measuring timber in forestry and wood industry. In Proceedings of the Austro 2007/FORMEC'07: Meeting the Needs of Tomorrows´Forests—New Developments in Forest Engineering, Wien, Austria, 7–11 October, 1–11 p.
Smith, V.G., 1979: Estimating the solid-wood content of stacked logs with minimum total cost. Can. J. For. Res. 9(2): 292–294. https://doi.org/10.1139/x79-049
Starke, M., Geiger, C., 2022: Field setup and assessment of a cloud-data based crane scale (CCS) considering weight and local green wood density-related volume references. Croat. J. For. Eng. 43(1): 29–45. https://doi.org/10.5552/crojfe.2022.1186
Sedmíková, M., Löwe, R., Jankovský, M., Natov, P., Linda, R., Dvořák, J., 2020: Estimation of over-and under-bark volume of scots pine timber produced by harvesters. Forests 11(6): 626. https://doi.org/10.3390/f11060626
Strandgard, M., Walsh, D., 2011: Improving harvester estimates of bark thickness for radiata pine (Pinus radiata D. Don). South. For. J. For. Sci. 73(2): 101–108. https://doi.org/10.2989/20702620.2011.610876
Tomczak, K., Berendt, F., Mederski, P., Tomczak, A., Cremer, T., Piotrowski, M., Kowalska, J., Purfürst, T., de Miguel-Díez, F., 2025: Accuracy, repeatability and time consumption of selected digital measurement methods of roundwood stacks. Meas.: J. Int. Meas. Confed. 245: 116640. https://doi.org/10.1016/j.measurement.2024.116640
Tomczak, A., Mederski, P.S., Naskrent, B., Tomczak, K., 2024: Accuracy of photo-optical timber measurement using a stereo camera technology. Croat. J. For. Eng. 45(1): 157–167. https://doi.org/10.5552/crojfe.2024.2268
Van Laar, A., Akça, A., 2007: Forest mensuration (Vol. 13). Springer Science & Business Media, Dordrecht, The Netherlands.
White, J.C., Wulder, M.A., Buckmaster, G., 2014: Validating estimates of merchantable volume from airborne laser scanning (ALS) data using weight scale data. For. Chron. 90(3): 378–385. https://doi.org/10.5558/tfc2014-072
Wilms, F., Duppel, N., Cremer, T., Berendt, F., 2021: Bark thickness and heights of the bark transition area of Scots pine. Forests 12(10): 1386. https://doi.org/10.3390/f12101386
Yu, C., Sun, Y., Cao, Y., He, J., Fu, Y., Zhou, X., 2023: A Novel wood log measurement combined mask R-CNN and stereo vision camera. Forests 14(2): 285. https://doi.org/10.3390/f14020285
Zhang, Q., Li, Y., Yu, C., Qi, J., Yang, C., Cheng, B., Liang, S., 2020: Global timber harvest footprints of nations and virtual timber trade flows. J. Clean. Prod. 250: 119503. https://doi.org/10.1016/j.jclepro.2019.119503
© 2025 by the authors. Submitted for possible open access publication under the
terms and conditions of the Creative Commons Attribution (CC BY) license (http://creativecommons.org/licenses/by/4.0/).
Authors' addresses:
dr. Ferréol Berendt *
e-mail: Ferreol.Berendt@hnee.de
Iman Bajalan
e-mail: Iman.Bajalan@hnee.de
Fabian Arndt
e-mail: Fabian.Arndt@hnee.de
Prof. dr. Tobias Cremerm
e-mail: Tobias.Cremer@hnee.de
Eberswalde University for Sustainable Development
Professorship Forest Utilization and Timber Markets
Schicklerstr. 5
16225, Eberswalde
GERMANY
Prof. dr. Benjamin Engler
e-mail: Benjamin.Engler@hnee.de
Eberswalde University for Sustainable Development
Professorship of Forest Work Science and Process Engineering
Schicklerstr. 5
16225 Eberswalde
GERMANY
* Corresponding author
Received: August 27, 2024
Accepted: August 22, 2025
Original scientific paper