
Evaluating and Modeling of Chainsaw Noise Propagation by Using Artificial Neural Network in Selective Cutting
doi: https://doi.org/10.5552/crojfe.2026.4340
volume: 47, issue: 1
pp: 14
- Author(s):
-
- Gülci Sercan
- Sessions John
- Gülci Neşe
- Article category:
- Original scientific paper
- Keywords:
- forest operations, sound effect, machine learning, wildlife, habitat
Abstract
HTML
The investigation of the effects of the noise generated by harvesting equipment on the environment is one of the important topics in sustainable forestry. During timber harvesting, not only workers but also wildlife are exposed to the noise generated. Exposure to noise has both direct and indirect effects on humans and wildlife. The negative effects of noise exposure can be observed depending on its intensity and duration. Noise exposure, which has various psychological and physiological effects on humans, also negatively affects plants and animals. In this study, sound measurements of the chainsaw were conducted during thinning operations within the boundaries of the Alara Forest Management Directorate in Alanya, Antalya Province. The measurement area is a Turkish red pine (Pinus brutia Ten.) stand with a canopy density of 60–65%, a slope of 30–35%, and tree diameters ranging from 20 to 35 centimeters. The noise emitted by the chainsaw during production, ranging from approximately 1 meter to 200 meters, has been modeled using a feedforward Artificial Neural Network (FANN) for sound propagation. The measurement data was used 60% for training, 20% for testing, and 20% for validation. Random trees were assigned to noise attenuation effects on the sound according to the stand characteristics of the study area. Thus, it was aimed to create a realistic sound propagation model and estimation maps. The average performance metrics of the model, RMSE and R² values, were calculated as 4.84 and 0.88, respectively. According to the sound propagation model predicted by the FANN as a static model, it is estimated that the distance at which the chainsaw could affect wildlife behavior is 400 meters or less.
Evaluating and Modeling of Chainsaw Noise Propagation by Using Artificial Neural Network in Selective Cutting
Sercan Gülci, John Sessions, Neşe Gülci
https://doi.org/10.5552/crojfe.2026.4340
Abstract
The investigation of the effects of the noise generated by harvesting equipment on the environment is one of the important topics in sustainable forestry. During timber harvesting, not only workers but also wildlife are exposed to the noise generated. Exposure to noise has both direct and indirect effects on humans and wildlife. The negative effects of noise exposure can be observed depending on its intensity and duration. Noise exposure, which has various psychological and physiological effects on humans, also negatively affects plants and animals. In this study, sound measurements of the chainsaw were conducted during thinning operations within the boundaries of the Alara Forest Management Directorate in Alanya, Antalya Province. The measurement area is a Turkish red pine (Pinus brutia Ten.) stand with a canopy density of 60–65%, a slope of 30–35%, and tree diameters ranging from 20 to 35 centimeters. The noise emitted by the chainsaw during production, ranging from approximately 1 meter to 200 meters, has been modeled using a feedforward Artificial Neural Network (FANN) for sound propagation. The measurement data was used 60% for training, 20% for testing, and 20% for validation. Random trees were assigned to noise attenuation effects on the sound according to the stand characteristics of the study area. Thus, it was aimed to create a realistic sound propagation model and estimation maps. The average performance metrics of the model, RMSE and R² values, were calculated as 4.84 and 0.88, respectively. According to the sound propagation model predicted by the FANN as a static model, it is estimated that the distance at which the chainsaw could affect wildlife behavior is 400 meters or less.
Keywords: forest operations, sound effect, machine learning, wildlife, habitat
1. Introduction
Forest harvesting operations are among the most important topics in sustainable forest management. By combining the requirements of forestry production and the philosophy of sustainability, innovative forest harvesting machines and tools have been developed. Thus, scientific research and technologies guiding modern forestry production contribute to sustainable use of forest ecosystems (Schweier et al. 2019). Engineering science has been used for optimum production and utilization in forest ecosystems that contain many variables. Within the scope of forest engineering, harvesting operations have been promoted and rapidly spreading to reduce environmental, economic and social impacts (Marchi et al. 2018). According to research on economic and environmental aspects within the scope of sustainable timber production, social aspects (physical workload, exposure to vibration, and noise) remain in the minority (Grünberg et al. 2023). Sustainable forest operations and timber production carried out within the scope of forestry activities is currently being implemented with the help of various mechanical tools and equipment (Sessions 2007). The most basic and common timber production tool is gasoline-powered chainsaws. Today, many types and models of motorized chainsaws with different features are still widely used. Battery-powered electric chainsaws, with the advantages of low noise and vibration, provide significant benefits for urban use and pruning tasks, while gasoline powered chainsaws are still preferred for heavier tasks (Montorselli et al. 2010, Colantoni et al. 2016, Neri et al. 2018). Research is ongoing to develop additional tools that could become sustainable timber harvesting equipment. Chainsaws used in forest operations, which are powerful, two-stroke engine tools, are highly useful. They are used for tree cutting and felling, bucking, and debarking in forestry production (Eker et al. 2011). There is a significant amount of research on the ergonomic use of chainsaws and their impact on worker health. Among these studies, the harmful effects of chainsaw vibration, noise, and exhaust emissions are quite common (Leszczyński 2014, Marchi et al. 2017, Golmohammadi and Darvishi 2020).
The studies focusing on the effects of chainsaw noise on workers' health are more prevalent than those investigating its environmental impact and the modeling of sound propagation. Chainsaws are among the noisy machines that have direct and indirect effects on other living organisms (especially wild animals) in forest ecosystems (Chan et al. 2010, Tilgar et al. 2022). The anthropogenic-based noise disturbance on wildlife is a threat especially for organisms living in terrestrial ecosystems (Barber et al. 2010). According to Billo et al. (2019), the noise levels in forestry work are 102.05 dB(A) for felling, 99.20 dB(A) for logging, and 95.14 dB(A) for delimbing. For example, the sound pressure level (Lp) according to ISO 22868 is 106 dB(A). The sound power level (Lw) according to ISO 22868 is 117 dB(A). The measured and the guaranteed sound power level have been determined in accordance with Directive 2000/14/EC, Annex V, and standard ISO 9207. Besides, Directive 2003/10/EC, which focuses on occupational health and safety by establishing exposure action values and limit values for workers' personal noise exposure, sets specific thresholds (ISO 1999:1990), including an upper exposure action value of 85 dB(A) and an exposure limit value of 87 dB(A), measured as daily or weekly personal exposure (EPC 2000, 2003). According to Stihl (2020), the measured sound power level is 117 dB and the guaranteed sound power level 119 dB(A). These values are above the recommended 85 dB(A) limit for long-term exposure and pose a risk to workers. For example, a worker operating at a sound level of 102 dB(A) can work without protection for only 45 minutes according to occupational health and safety regulations. Similarly, the maximum exposure time for a worker working at a sound level of 99.2 dB(A) is 1 hour. Hearing loss has been observed in chainsaw operators and forest workers due to time exposed to high frequency sounds (Tunay and Melemez 2008, Fonseca et al. 2015, Billo et al. 2019).
The noise produced by chainsaws, which has an impact on worker health, can also disturb wildlife, altering animal behavior, communication, and habitat use (Proto et al. 2016, Shannon et al. 2016). Some studies report that the responses of terrestrial wild animals begin at noise levels of approximately 40 dB(A) (Shannon et al. 2016). For example, Zeller et al. (2024) investigated wild animal responses to noise caused by human activities (hiking, mountain biking, trail running, and off-highway vehicles) carried out in recreation areas. Fleeing and vigilance responses of wild animals to noise ranging from 53 to 59 dB were observed. It was determined that recreational noise caused a decrease in wildlife in the environment. In addition, the disturbing effect of sound on wild animals is the most well-known example of its use as a repellent tool. Sound systems are among the active methods used to remove wild animals from the environment. They are audible (infrasonic), ultrasonic and biosonic sounds. Therefore, when evaluating the effects on animals, not only the dB(A) value but also factors such as the frequency composition and duration of exposure should be taken into account. Sound is used as a repellent especially to prevent birds from causing »bird strike« incidences at airports (Gülci 2011). In short, the direct effects of noise in habitats are more easily observed on wildlife. The presence of living things, that are directly or indirectly affected in their habitats, decreases. For example, birds or pollinator insects affected by the sound move away from the environment, which causes a decrease in pollination of plants. This situation can change plant communities and ecosystem structure in the long term (Francis et al. 2012). The effects of noise on the population are continuous and uncertain but potentially very serious, and managers should be cautious and prefer scientific, flexible and uncertainty-capable methods when making decisions (Wright et al. 2007). According to the Habitats Directive (92/43/EEC), any project or plan that may »affect« a protected area or species must be subject to appropriate assessment, regardless of whether the impact is direct, indirect or uncertain (EPC 1992).
It is easier to measure, model and control the noise emitted by a loud sound source in a defined area when compared to noise studies carried out in an open environment. In areas such as forests, where there are many different variations in interactions between living and non-living groups, noise measurement, propagation modeling and sound reducing studies will require high costs. Many methods and tools have been developed for sound pollution propagation modeling for different types of sound sources. The Noise Model Simulation (NMSim) is a computer model that generates time histories of noise from moving sources, taking into account the effects of real terrain on sound propagation (Ikelheimer and Plotkin 2005). SPreAD-GIS is one of the first free, open-source tools available for modeling the propagation of anthropogenic sound in natural ecosystems in a GIS environment (Reed et al. 2012). Proto et al. (2016) applied sound propagation models by using SPreAD-GIS to assess how sound travels through forested landscapes, considering variables such as terrain, vegetation, and machine types. Akay et al. (2022) performed the sound propagation analysis of the chainsaw used in the tree cutting stage of forest harvesting with SPreAD-GIS. It is quite difficult to determine the effect of sound pollution on wildlife with the help of conventional and classical equations because there are many environmental factors that are effective in sound damping. It may be appropriate to develop and use models that do not ignore these factors (Shannon et al. 2016).
In this study, the sound emitted by the chainsaw used during thinning cuts in a Turkish red pine stand was modeled using an artificial neural network. A model was created with feed forward ANN (FANN) in order to simulate the propagation of chainsaw sound in the stand environment. Considering field measurements and literature, a prediction model was created to estimate how far chainsaw sound can reach within the stand and it was discussed whether it would have an impact on wild animals. Briefly, FANN can accurately model chainsaw noise propagation during forest operations, and the distances of predicted noise levels that impact wildlife behavior.
2. Materials and Methods
2.1 Material
2.1.1 Study Area
This study was conducted in a Turkish red pine stand located within the boundaries of the Alara Forest Management Directorate in the Alanya District of Antalya Province. The measurements were taken on a sunny and slightly cloudy day during the summer season. The average temperature was 26°C, and the average wind speed was 7 km/h.
2.1.2 Software and Devices
In the study, a laptop with an i7 processor, 32 GB of RAM, and a 16 GB graphics card was used. The sound measurement was conducted using a Delta OHM HD2010 sound level meter. It is a sound measurement device suitable for free-field (FF) acoustic environment, with windscreen protection open, a sampling time of 0.031 seconds, multiple (MULTI) integration mode, an integration time of 5 seconds, a profile time of 0.125 seconds, a spectrum profiling time of 0.5 seconds, a 3 dB change rate, and capable of reaching a level of 141 dB.
All data preprocessing, model training, and visualization were conducted in a Jupyter Notebook environment using Python. Jupyter Notebook provides an interactive computational platform that facilitates step-by-step execution, debugging, and real-time visualization of results (Kluvyer et al. 2016). The notebook environment was integrated with TensorFlow and python libraries to perform sound attenuation modeling and analysis (McKinney 2012, Abadi et al. 2016).
2.2 Methods
2.2.1 Sound Measurement
Sound level measurements were carried out in the work area where tree cutting and log production re performed using a chainsaw in a forested area. The chainsaw operator was instructed to cut the trees we pointed out, which had been previously specified by the authorized forestry officials for cutting. The chainsaw was considered as the central sound source. Sound measurements were taken from the center of the slope upwards, towards the north. The measurements were started approximately 1 meter away from the sound source. Measurements were taken every 10 meters up to a total distance of 200 meters (Fig. 1). Distance measurements were conducted using a 10-meter synthetic rope, which was maintained as parallel to the ground surface as possible to follow the terrain profile accurately. The sound measurement device was carried at chest height (≈1.30 m) while the measurements were taken. The measurement duration was approximately 70 minutes.
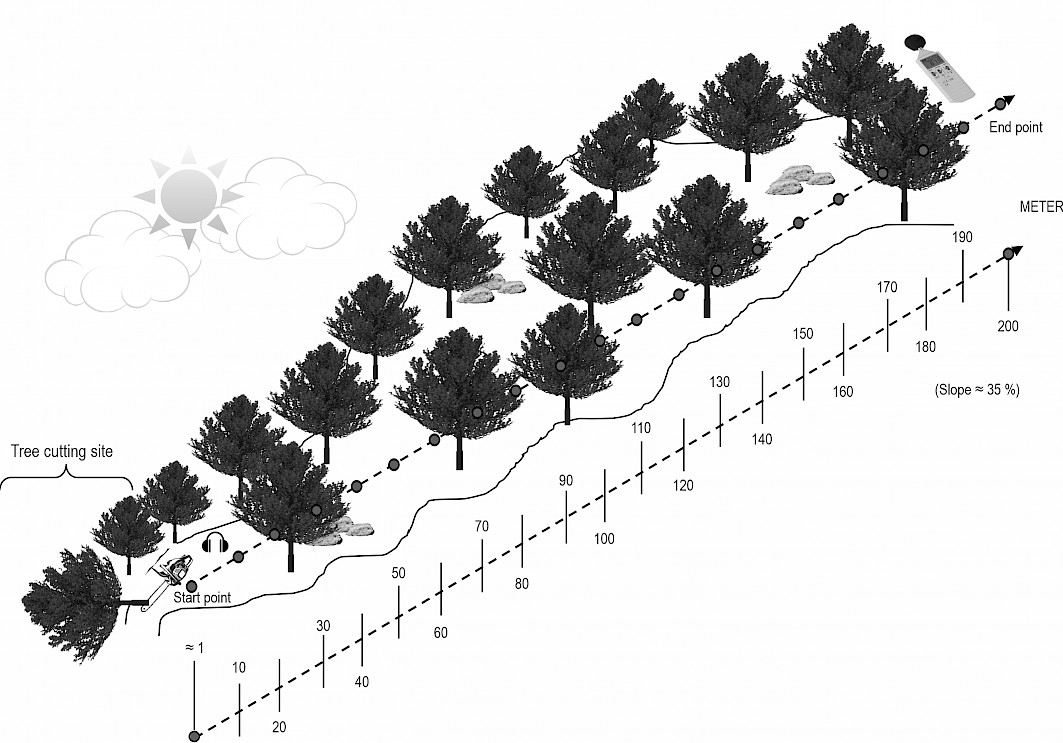
Fig. 1 Representation of uphill measurement points in the field
With the sound level meter, sound data including »LAeq_dB« (A-weighted Equivalent Continuous Sound Level), »LCpkmax_dB« (C-weighted Peak Sound Pressure Level ), and »LZFp_dB« (Z-weighting Fast Time-Weighted Sound Level ) were recorded every 5 seconds (Table 1). For the neural network (NN) sound propagation prediction model, distance and LAeq_dB values were used.
Table 1 Statistical summary of field measurements
|
LAeq_dB |
LCpkmax_dB |
LZFp_dB |
|
|
Count |
831 |
831 |
831 |
|
Mean |
61.95 |
83.85 |
73.64 |
|
Std |
13.94 |
11.82 |
9.45 |
|
Minimum |
42.6 |
67.5 |
59.9 |
|
25% |
52.1 |
74.9 |
66.7 |
|
50% |
56.4 |
79.9 |
70.3 |
|
75% |
68.7 |
90.55 |
78.4 |
|
Maximum |
101.6 |
122.4 |
105.1 |
|
Variance |
194.46 |
139.68 |
89.25 |
2.2.2 Data Pre-processing
The relationships between the independent variable (distance) and the dependent variable (sound level, in dB) were modeled based on the measurements obtained. First, the variables were standardized for use in the FANN analysis. Thus, it was aimed to make the model more sensitive to small-scale changes. Therefore, the distance (X) and sound dB (Y) variables were standardized as given in Eq. (1, 2).


Where:
μ the mean of the dataset
σ the standard deviation.
The ANN model was divided into training, testing, and validation sets using the sound data, with 60% for training, and 20% each for testing and validation. Thus, the ANN model was run to allow both learning and validation on the test data.
2.2.3 Artificial Neural Network (ANN) Model
In this study, modeling was performed using a feedforward artificial neural network (FANN). Feedforward neural networks, as one of the fundamental models in machine learning and artificial intelligence, have a wide range of applications. FANN models, developed with activation functions, optimization algorithms, and model evaluation methods, produce successful results in classification and regression problems (Glorot and Bengio 2010). The model structure consists of 1 input layer with 1 neuron, 4 hidden layers with 20 neurons each, and 1 output layer with 1 neuron (Fig. 2).
R
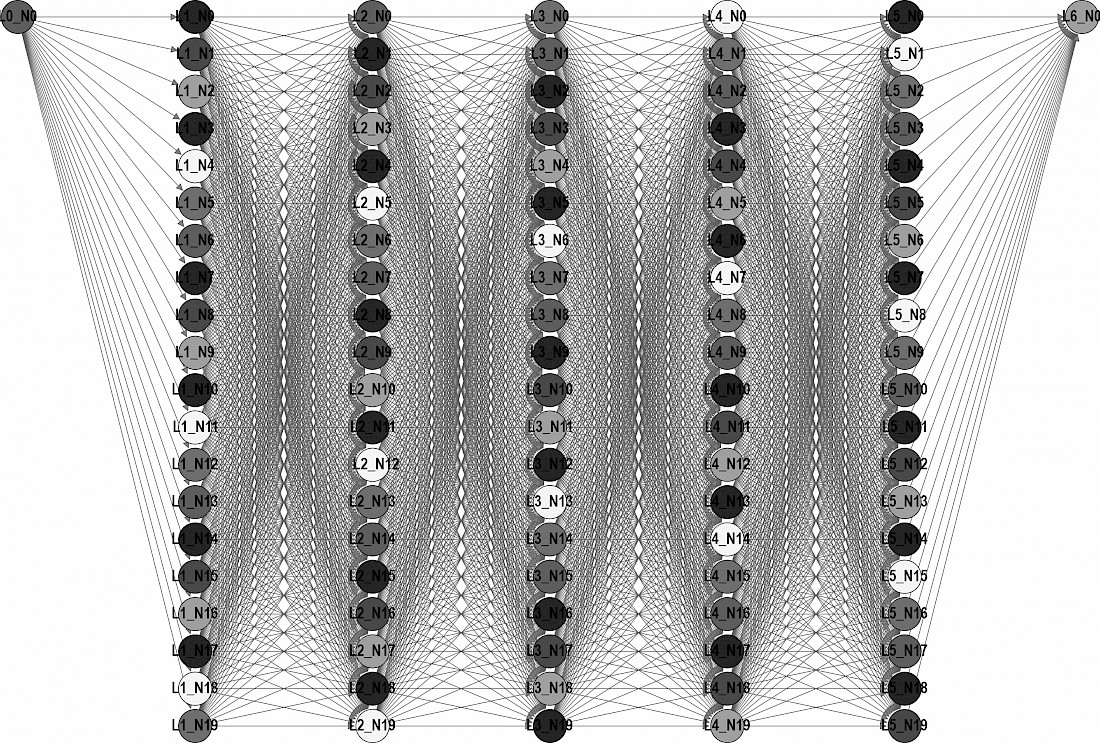
Fig. 2 Representation of performed neural network structure in this study
ReLU (Rectified Linear Unit) was used for the activation of the hidden layers. For predicting the sound level, a linear activation function was used for the output neuron. For compiling and training the model, the frequently used ADAM (Adaptive Moment Estimation) algorithm was used for optimizing the scattered data (Kingma and Ba 2014). The first equation calculates a moving average of the gradients (mt) using an exponential decay factor β1. The second equation computes a moving average of the squared gradients (vt) with decay factor β2. Finally, the third equation updates the parameters (θt) by subtracting a scaled version of the first moment (mt) divided by the square root of the second moment (vt) plus a small constant ϵ for numerical stability. This method adapts the learning rate for each parameter, leading to efficient convergence in training deep learning models. The dataset was created by repeating it 500 times and processing it in batches of 10 each time. Additionally, to prevent overfitting and avoid excessive training of the model, early stopping was used.


Where:
gt gradient
mt moment estimation
vt variance estimation
θt parameter update
α learning rate.
The difference between the observed instantaneous losses and the predicted sound levels was calculated using Mean Squared Error. Additionally, Mean Absolute Error (MAE), Root Mean Squared Error (RMSE), and R² Score (Coefficient of Determination) were used to evaluate model prediction performance.


2.2.4 Sound Distribution Area
A prediction model for sound distribution in a needleleaf forest environment was developed using the model trained with an ANN. A test area was created in a virtual environment to predict the impact area of the sound distribution model. The sound distribution was presented in a forest area with a ground slope of 35% and 65% canopy cover in the test area. A height function was created for any ymax and ymin point (Eq. 10, 11). The 3D terrain graph was visualized using the relationship between the maximum and minimum values of the created function and the 0.65 canopy coefficient. It was carried out by randomly distributing the diameter distributions of conifer species within the forest, with values ranging from 25 cm to 35 cm, across the area. Additionally, it was assumed that the crown area of the trees could range from 30 to 95 m² in a circular shape. Number of trees (Ntrees) was calculated by dividing the total area (m2) by the average tree crown area (Eq. 12).


Where:
z(y) elevation at the y point
ymin the lowest point on the y-axis
y any value on the y-axis
0.35 represents the slope of study area (35%).

Briefly, the aim here is to create a random tree placement in a terrain with a specific slope, simulating the number of trees, their locations, trunk diameters, and crown areas. Due to the effect of the slope, there are different z elevations at different y positions, and the tree crown areas have been randomly distributed according to a specific target (Fig. 3).
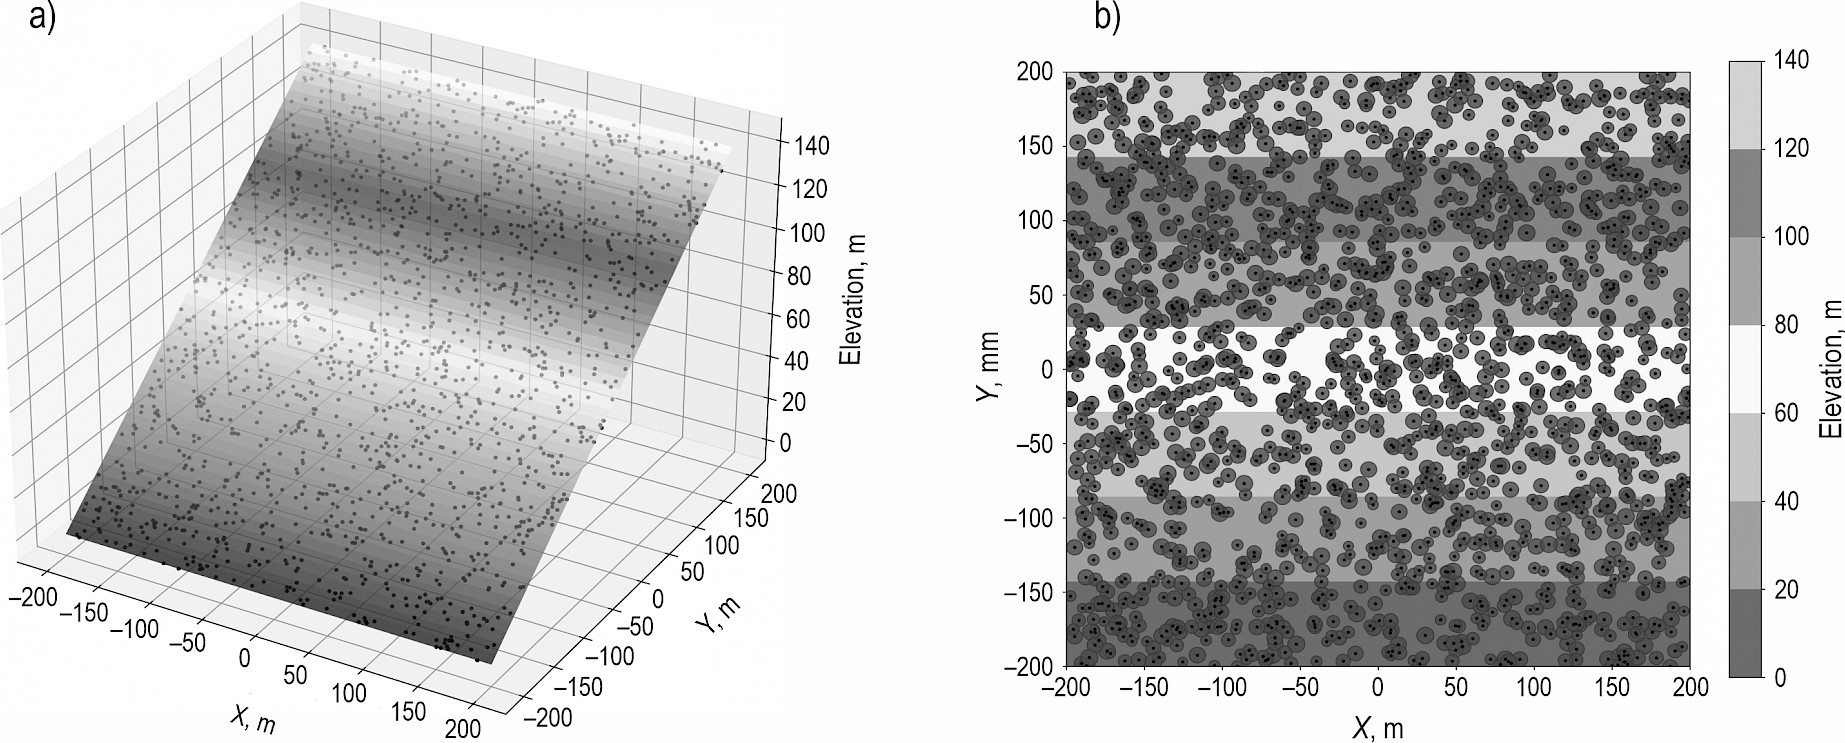
Fig. 3 3D simulation of the 35% slope terrain and distribution of pine trees (a), and 2D view of pine trees randomly scattered on terrain (b)
2.2.5 Sound Attenuation by Trees
Initially, grids were created in a two-dimensional plane. The sound levels predicted by the ANN model were applied to each grid. Then, the sound attenuation process was performed using a cyclic equation (Eq. 13). The randomly determined positions of the trees (tree_x = x[i]tree, tree_y = y[i]tree) and the radius calculated from the crown area (crown_radius = r[i]crown) were considered. The sound attenuation/sound barrier, depending on the vegetation density level, species, and physiological characteristics (such as diameter, branches, and leaf width), was considered to have a reducing effect of 2–3 dBA in a single tree and an average reduction of 9 to 11 dB in tree clusters with a depth of 5 m (Ow and Ghosh 2017, Lu et al. 2024). Considering ISO 9613-2:1996 (Acoustics – Attenuation of Sound during Propagation Outdoors), foliage and tree trunks further reduce sound beyond geometric spreading, with high dense forest cover potentially attenuating sound by 10–15 dB. Accordingly, a linear calculation was made, assuming that the sound level could be attenuated by 10 dB in the portion of the crown area of the tree, as predicted by the equation. In other words, a »binary« approach was adopted. In this study, each grid point was considered either fully under vegetation influence (10 dB reduction) or ineffective (0 dB reduction). Briefly, points within the crown area of any tree are true, and those outside are false.

3. Results
3.1 Field Measurements
In the field studies, sound measurements were taken at distances ranging from approximately 1 meter to 200 meters. The sound measurement records and measurement work were completed in approximately 1 hour and 10 minutes. The highest sound level produced by the chainsaw during operation was measured at 101.6 dB, while the lowest was measured at 42.6 dB (Table 2).
Table 2 Descriptive statistics of chainsaw sound (LAeq_dB) measurements
|
Distance, m |
Mean, dB |
SD, dB |
Minimum |
Maximum |
|
1 |
90.62 |
6.80 |
63.90 |
101.60 |
|
10 |
75.83 |
6.79 |
56.20 |
83.50 |
|
20 |
68.47 |
6.25 |
51.60 |
77.10 |
|
30 |
64.99 |
3.81 |
49.10 |
70.50 |
|
40 |
59.88 |
5.05 |
49.70 |
67.80 |
|
50 |
58.61 |
5.94 |
45.80 |
68.80 |
|
60 |
55.32 |
2.56 |
50.30 |
59.50 |
|
70 |
56.79 |
4.02 |
47.20 |
63.70 |
|
80 |
55.96 |
5.31 |
45.90 |
64.00 |
|
90 |
55.15 |
3.61 |
46.70 |
59.90 |
|
100 |
50.78 |
2.13 |
44.60 |
54.70 |
|
110 |
52.42 |
4.01 |
44.10 |
60.50 |
|
120 |
52.60 |
2.21 |
47.10 |
55.20 |
|
130 |
55.30 |
2.39 |
49.80 |
58.40 |
|
140 |
53.49 |
2.66 |
49.00 |
59.30 |
|
150 |
52.58 |
3.19 |
45.30 |
59.00 |
|
160 |
52.42 |
2.83 |
44.60 |
57.00 |
|
170 |
49.67 |
3.42 |
42.60 |
55.50 |
|
180 |
50.57 |
1.90 |
46.50 |
53.90 |
|
190 |
49.22 |
3.13 |
43.20 |
54.30 |
|
200 |
51.98 |
2.28 |
46.20 |
57.20 |
3.2 Data Training and Results
The developed FANN model used a fully connected structure starting with 1 input neuron, consisting of five layers (4 hidden layers, each with 20 neurons, and 1 output neuron). The model used the ReLU activation function and a linear output activation; the Adam optimization algorithm was used during the training process. The training data was split into 60%, followed by 20% for the test data, and 20% for the validation data. The model was instructed to be trained for 500 epochs with a batch size of 10. However, to prevent the model from being overtrained, the stop function was activated. Therefore, after 50 epochs, the model training reached an optimal position (Fig. 5). Since the RMSE and MAE were at reasonable levels, the MSE was interpreted as within an acceptable range (Table 3).
Table 3 The parametric values of the FANN model
|
MSE |
RMSE |
MAE |
R2 |
|
|
Training |
23.52 |
4.85 |
3.46 |
0.88 |
|
Validation |
22.66 |
4.76 |
3.37 |
0.89 |
|
Test |
24.07 |
4.91 |
3.54 |
0.88 |
It can be seen in Fig. 4 that the model generalizes the sound data measured in the field well and that the risk of overfitting is low. The model has not been able to capture each field measurement exactly, but it has been able to capture the overall trend. The model has accurately captured both the systematic decreasing trend and managed to keep a large portion of the data close to the prediction curve. This indicates that the model is generally capable of good generalization and that its predictions are consistent with the actual measurements. As the distance increases, the sound intensity decreases rapidly up to the first 50 meters.
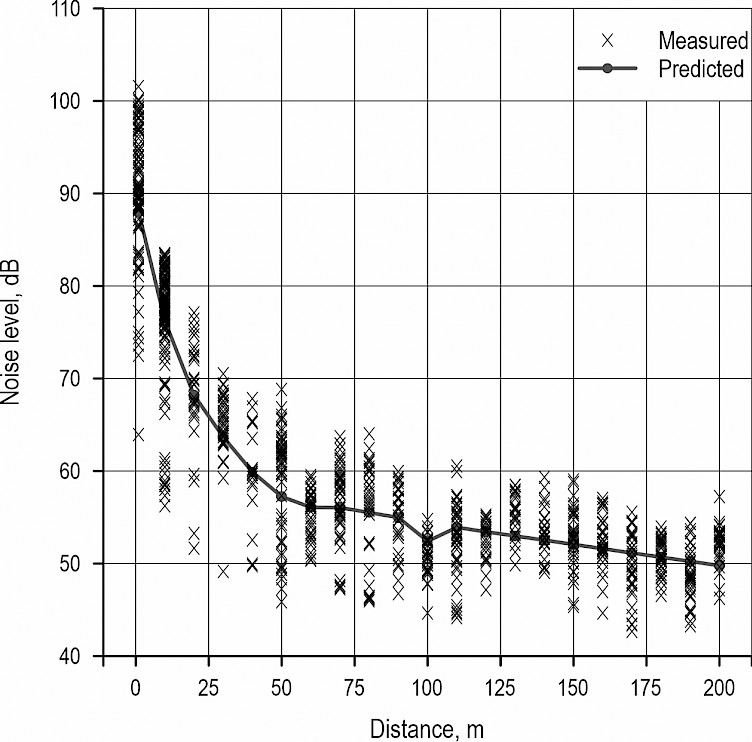
Fig. 4 Representation of the relationship between distance and sound with the measurement and prediction curves
The change in the training loss and validation loss values of the FANN model with respect to the number of epochs was shown in Fig. 5. In the early stages of training (during the first few epochs), it was observed that the training loss (grey curve) was high, but the losses were rapidly decreasing. This showed that the model was optimizing its parameters early on, leading to a decrease. The validation loss (black curve), which showed a similar behavior to the training loss, indicated that the model was fitting to the data.
During the first few epochs, both the training loss and the validation loss were decreasing rapidly. This showed that the model was quickly starting to learn and the weights were being optimized. The model was showing similar success on both the training data and the validation data. After approximately the 10th epoch, both the training and validation losses were reaching a low level, and the fluctuations were decreasing, gradually converging to a certain point This shows that the model was entering a stable learning process throughout the training. This situation shows that the model was having good generalization ability and that the training process was progressing effectively. The loss of this model stabilized at a low level, and there were no signs of overfitting. Thanks to the early stopping strategy (50 epochs), unnecessary prolonged training was prevented. For the model set to 500 epochs, similar results could have been obtained, but the computational intensity was avoided.
Model output provided the sound propagation pattern at distances of 600 (Fig. 6), 300, and 150 meters. As expected, the sound propagation decreased with the increase in distance. It was calculated that the sound propagation and intensity in the study area, with a canopy density of 65% and a terrain slope of 35%, could be affected by the surrounding approximately 14,976 trees. By coincidence, the trees scattered across the area attenuate the sound at a distance of 600 meters. Sound intensity and propagation were not homogeneous in the study area.
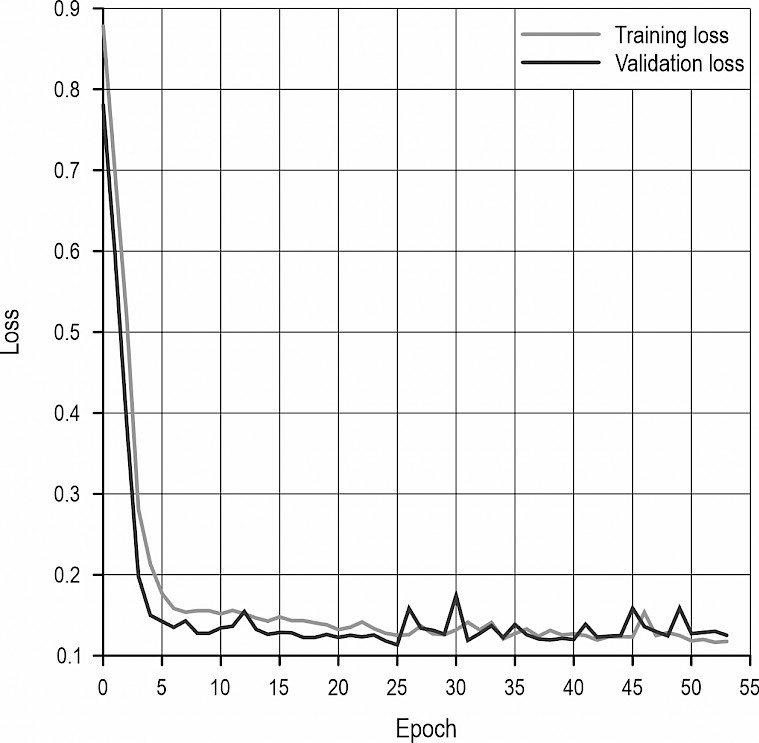
Fig. 5 Model training and validation loss
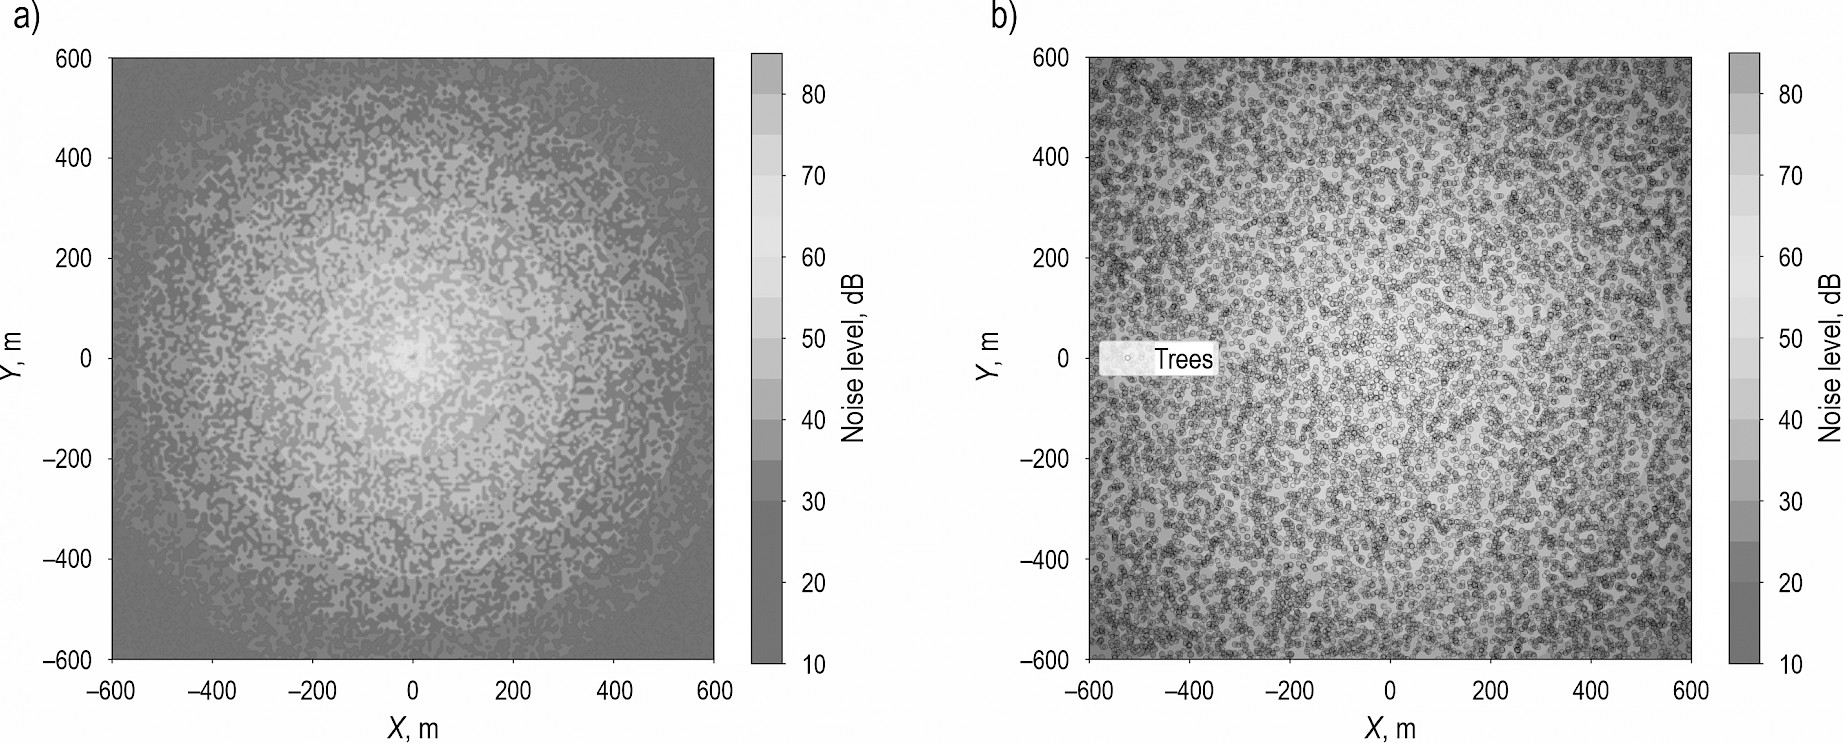
Fig. 6 Sound attenuation effect of trees in a simulated stand (a) and added trees (b) of sound propagation for 600 m
In the study area, the sound intensity propagation was diminishing at a distance of 300 m for 3744 trees randomly spread across the area (Fig. 7). According to the model, sound levels between 28 and 60 dB were observed, showing different distributions between 0 m and 300 m. It was calculated that the sound level could range between 36 dB and 46 dB at a distance of approximately 300 m. Due to the sound attenuation effect of the trees, it was observed that the sound level propagation was not spreading systematically into the environment.
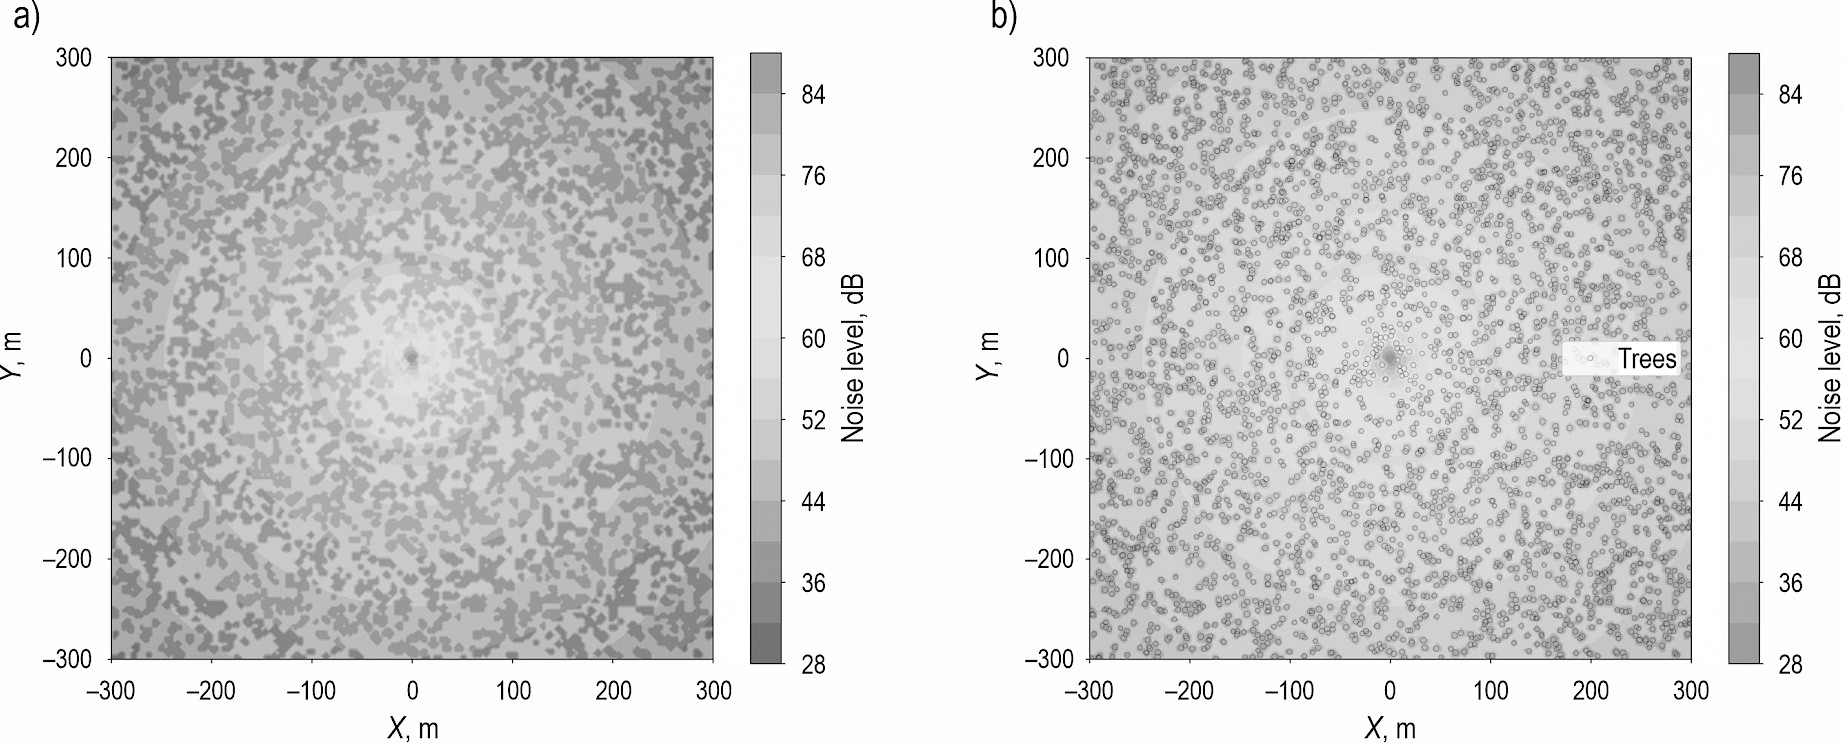
Fig. 7 Sound attenuation effect of trees in a simulated stand (a) and added trees (b) of sound propagation for 300 m
In the study area, 936 trees randomly spread across the area were attenuating sound at different intensities at a distance of 150 m (Fig. 8). At a distance of 150 m from the chainsaw, the sound level was audible down to a minimum of 52 dB, while due to the effect of the trees, it was calculated that the sound level could drop to 42 dB. The sound attenuation effect of the trees was different in sound propagation depending on the clustered tree groups. Rather than behaving like a sound pitch, it was observed that the sound was reflected.
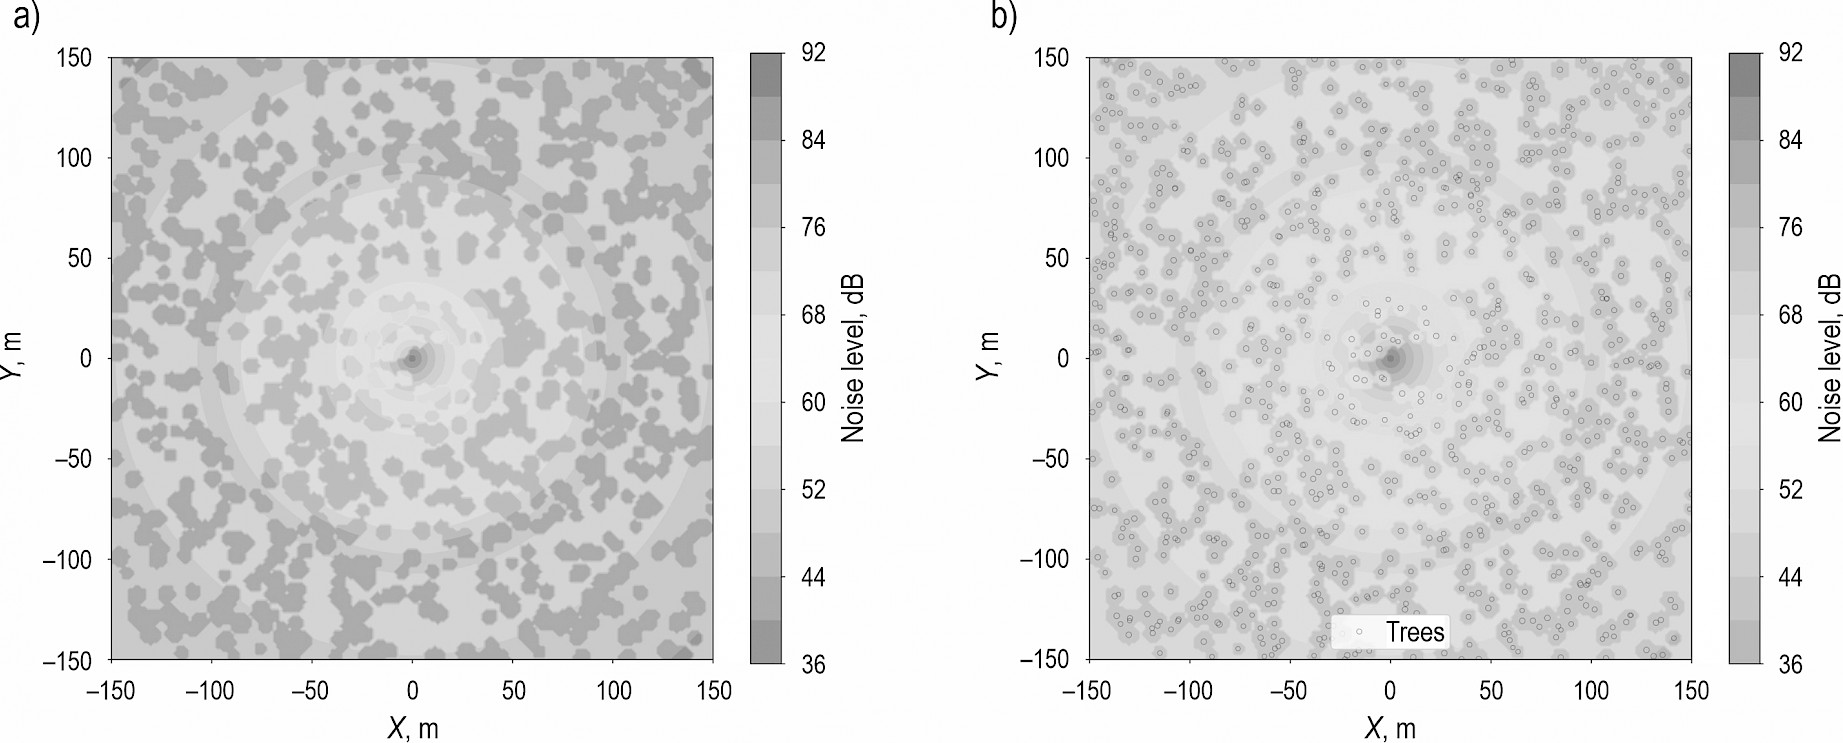
Fig. 8 Sound attenuation effect of trees in a simulated stand (a) and added trees (b) of sound propagation for 150 m
In the study area, 104 trees randomly spread across the area were attenuating sound at different intensities at a distance of 150 m (Fig. 9). It was observed that the sound was attenuated as desired in the locations where the trees were situated in the model. It was calculated that the sound intensity was above 69 dB up to a distance of approximately 20 m from the sound source. Additionally, due to the effect of the trees within a 20 m radius, it was estimated that the high sound level would drop to approximately 60 dB.
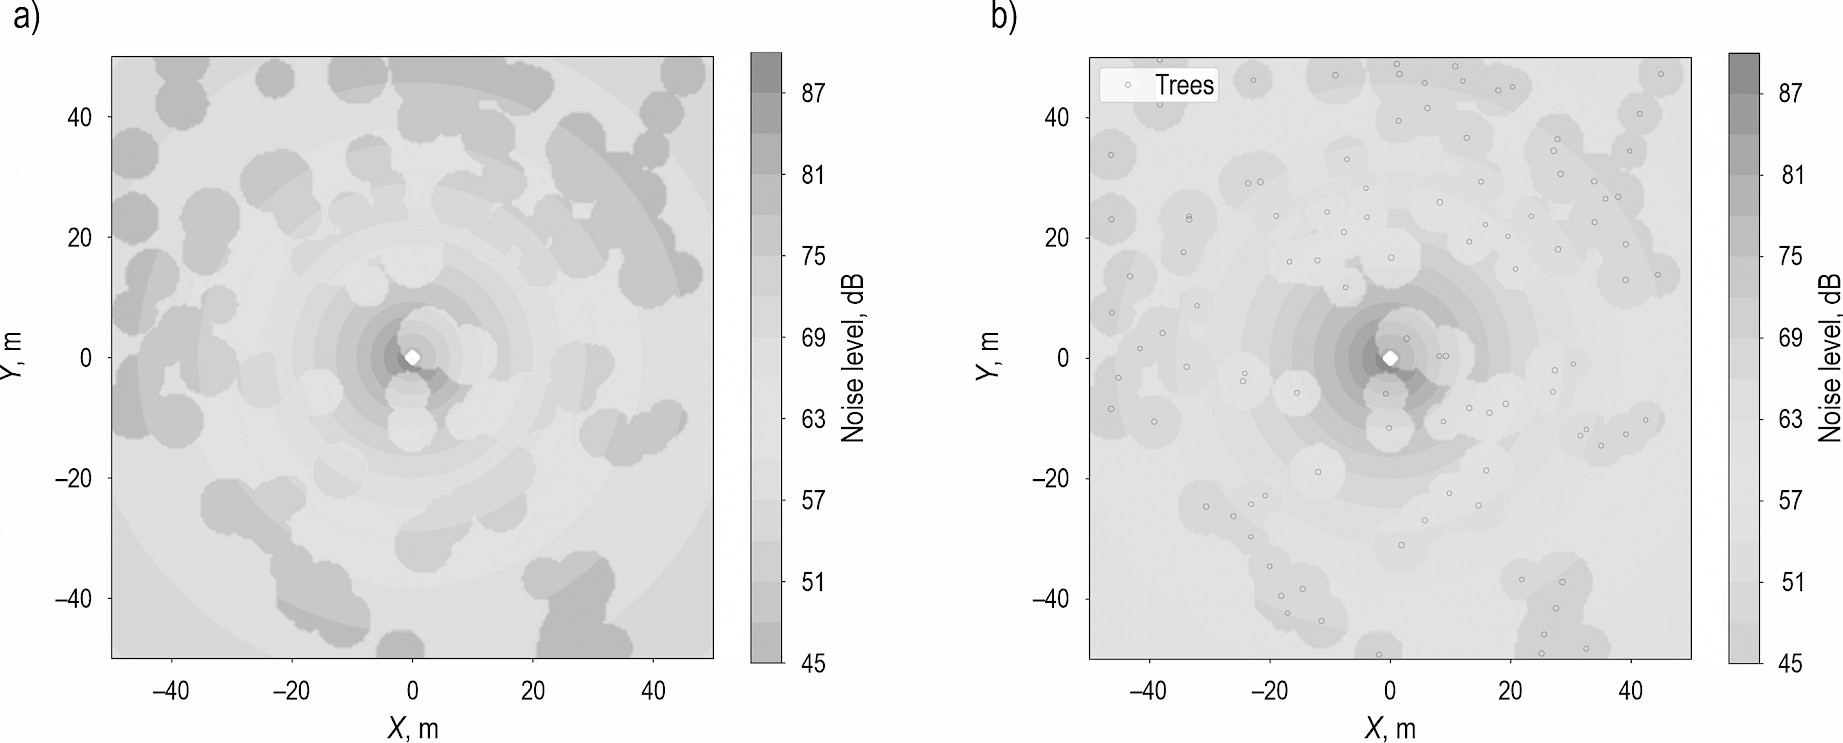
Fig. 9 Sound attenuation effect of trees in a simulated stand (a) and added trees (b) of sound propagation for 50 m
3.3 Limitations
In this study, the FANN-based sound propagation prediction model was successfully generalized, and the model was created. This study was important as it could be carried out in more detail in the future and provide ideas for researchers. However, in this study, the measurements were taken in a stand with a certain canopy density in the model, with the slope facing upwards. The measurements were conducted only during the summer season. These measurement data were conditionally generalized based on the specific environmental characteristics of the measurement area to estimate sound attenuation values under comparable conditions. The measurements were taken on the slope above the noise source. It is necessary to make the model more reliable to topography by obtaining measurements in different slope and elevation classes. Additionally, model development did not consider wind, humidity, temperature and stand characteristics (such as tree species, tree diameter, density, etc.). The inability to perform synchronized measurements by using multiple measurement devices simultaneously, instead of just one sound measurement device, was another limitation of this study.
4. Discussion
According to the field measurement results, the chainsaw sound could range from an average of 52 dB to 91 dB between 1 m and 200 m (Table 2). Due to the high-level sound exposure at close distances to the chainsaw, the worker could experience permanent hearing damage without hearing protection. According to the value produced by the FANN model, it was estimated that the sound level would drop below 80 dB after approximately 8 m. If the chainsaw operator works without using personal protective equipment, there is a possibility of experiencing health problems due to exposure to high sound levels. Depending on the duration of exposure for individuals within this distance, the likelihood of experiencing an increase in blood pressure, acceleration of heartbeat and respiration, and headache is very high (Tunay and caMelemez 2008).
Additionally, according to the FANN-based sound propagation model, it was estimated that sound could spread between 40 dB and 90 dB at distances from 0 to 440 m. According to the model, a high acoustic sound level was observed at a distance of 10 m from the chainsaw. Staněk et al. (2023) stated that the highest possible acoustic sound around the area where the operator works with the Stihl MS362 chainsaw occurs up to a distance of 21 m. Indeed, at these distances, the reactions of wildlife and the negative effects on wildlife can be observed in a short period of time. In areas exposed to short-term high levels of sound, a noticeable decrease in bird species diversity can be observed (Shannon et al. 2016, Iglesias-Merchan et al. 2019). Not only birds but also other terrestarial animals can be affected due to chainsaw operations. For example, a study has shown that chainsaw use disrupts the gibbons' natural behavior, increasing their risk to survival, indicating that noise pollution should be taken into account in conservation and forest management (McGrath et al. 2024).
The sound propagation predictions observed at a distance of 400–500 m in the study area are similar to the sound levels produced by a group engaged in recreational activities. Therefore, due to the presence of mammalian wildlife (deer, foxes, and black bears) in the area, they will exhibit fleeing and vigilance behaviors due to their height (Zeller et al. 2024). While bird mobbing calls can normally be heard up to 150–200 m, when mixed with chainsaw sound at a distance of 200 m (with a sound level of approximately 58 dB), they can only be heard within a radius of 50–100 m. The sound from the production machinery used in forestry operations will affect the birds' mobbing response (Tilgar et al. 2022). In short, for sound-dependent wildlife species involved in risk detection, spatial awareness, and territory defense, human-caused sound can disturb them or affect their ability to respond to biologically significant sounds, such as those produced by predators or territory invaders (Chan et al. 2010). In this study, according to the model sound propagation predictions up to a distance of 1000 m, it was found that the sound could decrease to approximately ≈5 dB. Indeed, in sound propagation studies conducted within the scope of roadside effects, evaluations are made with a range that does not exceed 1000 m (Reijnen et al. 1997). In this study, it was found that the chainsaw working area could affect wildlife at distances up to 400 m. McClure et al. (2013) assess that traffic noise can have a direct effect on birds availability ratio up to at least 500 m away. The sound propagation model developed was helpful in determining the impact area. However, it should be considered that the sound was directed upward from the center of the sound source (Table 4). Besides the effect of sound on wildlife depending on distance, it could also vary depending on the characteristics of the habitat. Depending on the frequency composition and exposure duration change, different effects may be observed at varying distances for different wildlife species (Francis and Barber 2013). An assessment must be made for the existence of any impact during logging activities that could affect a species in a protected area (EPC 1992).
Table 4 Comparison of previous studies on chainsaw propagation distances
|
Study |
Model |
Max. Sound Level (dB) |
Brand/Description |
|
This study |
FANN |
≈57 |
Chainsaw sound level at 50 m |
|
≈40–47 |
Sound level due to attenuation by trees at 50 m |
||
|
≈50 |
Chainsaw sound level at 200 m |
||
|
≈40 |
Sound level due to attenuation by trees at 200 m |
||
|
Potočnik et al. (2010) |
LZeq(dB)=109.765-28.016*log(distance) |
≈62 |
Stihl MS 460 / Chainsaw sound level at 50 m |
|
≈45 |
Chainsaw sound level at 200 m |
||
|
Staněk et al. (2023) |
Direct measurement |
80 |
Stihl MS 362 / Chainsaw sound level at 21 m |
|
Anuar et al. (2024) |
dBA=93.946-0.91*(distance) |
≈84–90 |
Not available / Chainsaw sound level at 5 m |
|
≈72–77 |
Chainsaw sound level at 20 m |
||
|
≈48 |
Chainsaw sound level at 50 m |
In this study, at distances between 400 and 650 m, the sound intensity was between 30 dB and 40 dB, while for distances of 600 m and beyond, the sound level was calculated to be <30 dB due to the sound attenuation effect of the trees. According to the model, the calculated sound level at a distance of 400 m in a windy environment was found to be at the level of a person whispering from 150 cm to 5 m away, or the rustling sound of leaves swaying in the wind (Berger et al. 2016). The chainsaw sound is at a level that cannot be heard in a natural habitat, such as a forested area, after 600 m.
In this study, it was understood that wildlife in areas with similar characteristics and minimum sound attenuation could respond to sound at distances of 450–500 m. Studies could be carried out to reduce the negative impacts on wildlife and worker health. In particular, regular maintenance of chainsaws is important. Muffler damage, improper bar oil, and dull chain can all affect noise levels. Dull chains also increase the duration of the noise since productivity is reduced. The use of electric chainsaws could be encouraged.
5. Conclusion
This noise model provides useful data for understanding how sound propagates in an environment with trees and where it concentrates. It was estimated that the chainsaw sound could affect wildlife up to 400 m and that the sound would propagate up to a distance of 600 m. Considering the attenuation effect of forest trees in the study area, the rate of impact on wild animals will decrease after 200 m from the source of the sound. It was determined that the chainsaw sound could be below 30 dB after 600 meters. This study showed the need to establish a baseline propagation pattern under controlled variables which can serve as a reference for future multi-directional or seasonally varied measurements. Modeling from forested areas with different attributes using ANN has the potential to contribute to sustainable timber production efforts. Therefore, for more detailed analyses, it is necessary to consider the acoustic characteristics of the environment (e.g., reflections, absorption) in the measurements. The results can be classified based on time or spatially, and compared with specific standard values.
6. References
Abadi, M., Agarwal, A., Barham, P., Brevdo, E., Chen, Z., Citro, C., Corrado, G.S., Davis, A., Dean, J., Devin, M., Ghemawat, S., Goodfellow, I., Harp, A., Irving, G., Isard, M., Jia, Y., Jozefowicz, R., Kaiser, L., Kudlur, M., Levenberg, J., Mane, D., Monga, R., Moore, S., Murray, D., Olah, C., Schuster, M., Shlens, J., Steiner, B., Sutskever, I., Talwar, K., Tucker, P., Vanhoucke, V., Vasudevan, V., Viegas, F., Vinyals, O., Warden, P., Wattenberg, M., Wicke, M., Yu, Y., Zheng, X., 2016: Tensorflow: Large-scale machine learning on heterogeneous distributed systems. arXiv:1603.04467. http://doi.org/10.48550/arXiv.1603.04467
Akay, A., Acar, H., Kalkan, B., 2022: Using GIS techniques for modeling of anthropogenic noise propagation generated by a chainsaw in forest harvesting. Sumar. list. 146(7–8): 333–344. https://doi.org/10.31298/sl.146.7-8.5
Anuar, N.A., Gandaseca, S., Ismail, M.H., 2024: Noise level assessment of chainsaw during felling and bucking operations in Pasoh Forests Peninsular Malaysia. Proceedings of the International Conference on Science Technology and Social Sciences-Physics, Material and Industrial Technology (ICONSTAS-PMIT 2023). Adv. Eng. Res. 238. https://doi.org/10.2991/978-94-6463-500-3_12
Barber, J.R., Crooks, K.R., Fristrup, K.M., 2010: The costs of chronic noise exposure for terrestrial organisms. Trends Ecol. Evol. 25(3): 180–189. https://doi.org/10.1016/j.tree.2009.08.002
Berger, E.H., Neitzel, R., Kladden, C.A., 2016: Noise navigator sound level database with over 1700 measurement values. E-A-R 88-34/HP: Indianapolis, Ind., 3M. Available online: https://multimedia.3m.com/mws/media/888553O/noise-navigator-sound-level-hearing-protection-database.pdf (accessed on June 13, 2024)
Billo, D., Mendes, L., Nascimento, G., Fiedler, N., Berude, L., 2019: Analysis of noise transmitted to workers in motor-manual forest harvesting in Minas Gerais State. Floresta Ambient. 26(Spec No 1): e20180395. https://doi.org/10.1590/2179-8087.039518
Chan, A.A.Y.H., Stahlman, W.D., Garlick, D., Fast, C.D., Blumstein, D.T., Blaisdell, A.P., 2010: Increased amplitude and duration of acoustic stimuli enhance distraction. Anim. Behav. 80(6): 1075–1079. https://doi.org/10.1016/j.anbehav.2010.09.025
Colantoni, A., Mazzocchi, F., Cossio, F., Cecchini, M., Bedini, R., Monarca, D., 2016: Comparisons between battery chainsaws and internal combustion engine chainsaws: Performance and safety. Contemp. Eng. Sci. 9(27): 1315–1337. https://doi.org/10.12988/ ces.2016.68133
EPC., 1992: Council Directive 92/43/EEC of 21 May 1992 on the conservation of natural habitats and of wild fauna and flora. Official Journal of the European Communities, L206, 7–50. Available online: http://data.europa.eu/eli/dir/1992/43/2013-07-01 (accessed on June 12, 2025)
EPC., 2000. Directive 2000/14/EC of the European Parliament and of the Council of 8 May 2000 on the approximation of the laws of the Member States relating to the noise emission in the environment by equipment for use outdoors. Official Journal of the European Communities, L162, 1–75. Available online: https://eur-lex.europa.eu/legal-content/EN/TXT/?uri=CELEX%3A32000L0014 (accessed on February 12, 2025)
EPC., 2003. Directive 2003/10/EC of the European Parliament and of the Council of 6 February 2003 on the minimum health and safety requirements regarding the exposure of workers to the risks arising from physical agents (noise) (Seventeenth individual Directive within the meaning of Article 16(1) of Directive 89/391/EEC). Available online: http://data.europa.eu/eli/dir/2003/10/oj (accessed on June 12, 2025)
Eker, M., Çoban, H.O., Acar, H.H., 2011: Time study and productivity analysis of chainsaw mounted log debarker in southern pine forests of Turkey. Afr. J. Agric. Res. 6(10): 2146–2156. https://doi.org/10.5897/AJAR11.196
Fonseca, A., Aghazadeh, F., de Hoop, C., Ikuma, L., Al-Qaisi, S., 2015: Effect of noise emitted by forestry equipment on workers' hearing capacity. Int. J. Ind. Ergon. 46: 105–112. https://doi.org/10.1016/j.ergon.2014.05.001
Francis, C.D., Kleist, N.J., Ortega, C.P., Cruz, A., 2012: Noise pollution alters ecological services: enhanced pollination and disrupted seed dispersal. Proceedings of the Royal Society B: Biological Sciences 279(1739): 2727–2735. http://dx.doi.org/10.1098/rspb.2012.0230
Francis, C.D., Barber, J.R., 2013: A framework for understanding noise impacts on wildlife: an urgent conservation priority. Front. Ecol. Environ. 11(6): 305–313. https://doi.org/10.1890/120183
Glorot, X., Bengio, Y., 2010: Understanding the difficulty of training deep feedforward neural networks. In Proceedings of the thirteenth international conference on artificial intelligence and statistics (AISTATS) 2010, Chia Laguna Resort, Sardinia, Italy. PMLR 9: 249–256.
Golmohammadi, R., Darvishi, E., 2020: The combined effects of occupational exposure to noise and other risk factors-a systematic review. Noise & Health 21(101): 125–141. https://doi.org/10.4103/nah.nah_4_18
Grünberg, J., Ghaffariyan, M.R., Jourgholami, M., Labelle, E.R., Kaakkurivaara, N., Robert, R.C.G., Kühmaier, M., 2023: Criteria for assessing the sustainability of logging operations – a systematic review. Curr. For. Rep. 9(5): 350–369. https://doi.org/10.1007/s40725-023-00198-x
Gülci, S., 2011: Effects of birds on flight safety at Trabzon International Airport, Turkey. MsC Thesis. Trabzon, 108 p.
Iglesias-Merchan, C., Ortiz-Urbina, E., Ezquerro, M., Diaz-Balteiro, L., 2019: Incorporating acoustic objectives into Forest Management Planning when sensitive bird species are relevant. PeerJ 7: e6922. https://doi.org/10.7717/peerj.6922
Ikelheimer, B., Plotkin, K., 2005: Noise Model Simulation (NMSim) User's Manual. Wyle Laboratories Report WR 03, 9. Available online: https://nwtteis.com/portals/nwtteis/files/references/Ikelheimer_2004_NMSim_User_Manual.pdf (accessed on March 10, 2025)
Kingma, D., Ba, J., 2014: Adam: A method for stochastic optimization. arXiv preprint arXiv:1412.6980. https://doi.org/10.48550/arXiv.1412.6980
Kluyver, T., Ragan-Kelley, B., Pérez, F., Granger, B., Bussonnier, M., Frederic, J., Kelley, K., Hamrick, J., Grout, J., Corlay, S., Ivanov, P., Avila, D., Abdalla, S., Willing, C., Jupyter development team, 2016: Jupyter Notebooks – a publishing format for reproducible computational workflows. IOS Press, Positioning and Power in Academic Publishing: Players, Agents and Agendas, F. Loizides and B. Schmidt (Eds.): 87–90. http://dx.doi.org/10.3233/978-1-61499-649-1-87
Leszczyński, K., 2014: The concentration of carbon monoxide in the breathing areas of workers during logging operations at the motor-manual level. Int. J. Occup. Med. Environ. Health 27(5): 821–829. https://doi.org/10.2478/s13382-014-0300-x
Lu, J., Kong, F., Yin, H., Middel, A., Kang, J., Wen, Z., Liu, H., 2024: Evaluating sound attenuation of single trees using 3D information. J. Environ. Manage. 370: 122818. https://doi.org/10.1016/j.jenvman.2024.122818
Marchi, E., Neri, F., Cambi, M., Laschi, A., Foderi, C., Sciarra, G., Fabiano, F., 2017: Analysis of dust exposure during chainsaw forest operations. iForest-Biogeosciences and Forestry 10(1): 341–347. https://doi.org/10.3832/ifor2123-009
Marchi, E., Chung, W., Visser, R., Abbas, D., Nordfjell, T., Mederski, P.S., Laschi, A., 2018: Sustainable Forest Operations (SFO): A new paradigm in a changing world and climate. Sci. Total Environ. 634: 1385–1397. https://doi.org/10.1016/j.scitotenv.2018.04.084
McClure, C.J., Ware, H.E., Carlisle, J., Kaltenecker, G., Barber, J.R., 2013: An experimental investigation into the effects of traffic noise on distributions of birds: avoiding the phantom road. Proceedings of the Royal Society B: Biological Sciences 280(1773): 20132290. http://dx.doi.org/10.1098/rspb.2013.2290
McGrath, S.J., Malone, N., Behie, A.M., 2024: Effects of chainsaw noise on the activity budgets and calling behaviour of the northern yellow‐cheeked crested gibbon (Nomascus annamensis). Wildl. Biol. 2024(5): e01196. https://doi.org/10.1002/wlb3.01196
McKinney, W., 2012: Python for data analysis: Data wrangling with Pandas, NumPy, and IPython. O'Reilly Media, Inc.
Montorselli, N.B., Lombardini, C., Magagnotti, N., Marchi, E., Neri, F., Picchi, G., Spinelli, R., 2010: Relating safety, productivity and company type for motor-manual logging operations in the Italian Alps. Accid. Anal. Prev. 42(6): 2013–2017. https://doi.org/10.1016/j.aap.2010.06.011
Neri, F., Laschi, A., Foderi, C., Fabiano, F., Bertuzzi, L., Marchi, E., 2018: Determining noise and vibration exposure in conifer cross-cutting operations by using Li-Ion batteries and electric chainsaws. Forests 9(8): 501. https://doi.org/10.3390/f9080501
Ow, L.F., Ghosh, S., 2017: Urban cities and road traffic noise: Reduction through vegetation. Appl. Acoust. 120: 15–20. https://doi.org/10.1016/j.apacoust.2017.01.007
Potočnik, I., Poje, A., 2010: Noise pollution in forest environment due to forest operations. Croat. J. For. Eng. 31(2): 137–148.
Proto, A.R., Grigolato, S., Mologni, O., Macrì, G., Zimbalatti, G., Cavalli, R., 2016: Modelling noise propagation generated by forest operations: a case study in Southern Italy. Procedia Soc. Behav. Sci. 223: 841–848. https://doi.org/10.1016/j.sbspro.2016.05.290
Reed, S.E., Boggs, J.L., Mann, J.P., 2012: A GIS tool for modeling anthropogenic noise propagation in natural ecosystems. Environ. Model. Softw. 37: 1–5. https://doi.org/10.1016/j.envsoft.2012.04.012
Reijnen, R., Foppen, R., Veenbaas, G., 1997: Disturbance by traffic of breeding birds: evaluation of the effect and considerations in planning and managing road corridors. Biodiv. Conserv. 6(4): 567–581. https://doi.org/10.1023/A:1018385312751
Schweier, J., Magagnotti, N., Labelle, E.R., Athanassiadis, D., 2019: Sustainability impact assessment of forest operations: a review. Curr Forestry Rep. 5(3): 101–113. https://doi.org/10.1007/s40725-019-00091-6
Sessions, J., 2007: Harvesting operations in the tropics. Berlin, Heidelberg: Springer Berlin Heidelberg.
Shannon, G., McKenna, M.F., Angeloni, L.M., Crooks, K.R., Fristrup, K.M., Brown, E., Warner, K.A., Nelson, M.D., White, C., Briggs, J., McFarland, S., Wittemyer, G., 2016: A synthesis of two decades of research documenting the effects of noise on wildlife. Biol. Rev. 91(4): 982–1005. https://doi.org/10.1111/brv.12207
Staněk, L., Nevrkla, P., Jankových, L., Zemánek, T., 2023: Rate of chainsaw vibrations in laboratory conditions and level of chainsaw noise at different distances. Balt. For. 29(2): id638. doi: https://doi.org/10.46490/BF638
Stihl., 2020: Stihl MS 362 C-M: Instruction Manual. Available online: https://cdnassets.stihlusa.com/1625860704-stihl-ms-362-c-m-owners-instruction-manual.pdf. (accessed on February 25, 2025)
Tilgar, V., Hein, K., Viigipuu, R., 2022: Anthropogenic noise alters the perception of a predator in a local community of great tits. Anim. Behav. 189: 91–99. https://doi.org/10.1016/j.anbehav.2022.05.001
Tunay, M., Melemez, K., 2008: Noise induced hearing loss of forest workers in Turkey. Pak. J. Biol. Sci. 11(17): 2144–2148. https://doi.org/10.3923/pjbs.2008.2144.2148
Wright, A.J., Soto, N.A., Baldwin, A.L., Bateson, M., Beale, C.M., Clark, C., Deak, T., Edwards, E.F., Fernández, A., God inho, A., Hatch, L.T., Kakuschke, A., Lusseau, D., Martineau, D., Romero, M.L., Weilgart, L.S., Wintle, B.A., Notarbar tolo-di-Sciara, G., Martin, V., 2007: Anthropogenic noise as a stressor in animals: a multidisciplinary perspective. Int. J. Comp. Psychol. 20(2): 250–273. https://doi.org/10.46867/ijcp.2007.20.02.02
Zeller, K.A., Ditmer, M.A., Squires, J.R., Rice, W.L., Wilder, J., DeLong, D., Barber, J.R., 2024: Experimental recreationist noise alters behavior and space use of wildlife. Curr. Biol. 34(13): 2997–3004. https://doi.org/10.1016/j.cub.2024.05.030
© 2025 by the authors. Submitted for possible open access publication under the
terms and conditions of the Creative Commons Attribution (CC BY) license (http://creativecommons.org/licenses/by/4.0/).
Authors' addresses:
Assoc. prof. Sercan Gülci, PhD *
e-mail: sgulci@ksu.edu.tr
Assoc. prof. Neşe Gülci, PhD
e-mail: nesegulci@gmail.com
Kahramanmaras Sutcu Imam University
Faculty of Forestry
Department of Forest Engineering
Avsar Mah. Bati Cevreyolu Blv.
46040 Onikisubat-Kahramanmaras
TURKIYE
Prof. John Sessions, PhD
e-mail: john.sessions@oregonstate.edu
Oregon State University
College of Forestry
336 Peavy Forest Science Complex
Corvallis OR 97331-5704
USA
* Corresponding author
Received: April 08, 2025
Accepted: June 11, 2025
Original scientific paper