
Lessons Learned from a Case Study in Switzerland – Use of a Double-Hitch Carriage for Yarding
doi: https://doi.org/10.5552/crojfe.2026.4065
volume: 47, issue: 1
pp: 13
- Author(s):
-
- Schweier Janine
- Perry Niál T.
- Werder Marc
- Bont Leo
- Article category:
- Original scientific paper
- Keywords:
- forest operation, productivity analysis, reduced-impact logging, time study, tower yarder
Abstract
HTML
In some specific yarding situations ground contact needs to be reduced to an absolute minimum. In such cases, a double-hitch system can serve as an alternative to helicopter logging. In the present investigation, a cable yarding operation using double-hitch carriages for selective thinning in intermediate slope was accompanied by a time and motion study to better understand the working steps and resulting productivity of cable yarding in this unconventional situation. The main aims were to develop a model that can be used to estimate the productivity of comparable yarding operations before their implementation, and to quantify the additional effort relative to the use of a cable yarder with a single-hitch carriage. The results indicated an overall productivity of 5.69 m3ob per productive system hour including delays of up to 15 minutes (PSH15), leading to yarding costs of 104.40 € (m3ob)-1 (in addition to costs for installation and felling). Compared to a system with a common single-hitch carriage, the inclusion of a second lateral yarding stage increased time and cost, contributing 13.30 € (m3ob)-1. Key factors affecting productivity were payload size, number of load pieces, and terrain difficulty, while yarding distances had minimal impact. Compared with traditional yarding, double-hitch operations were less productive and more costly, but they can still be considered a suitable alternative to helicopter logging in sensitive areas.
Lessons Learned from a Case Study in Switzerland – Use of a Double-Hitch Carriage for Yarding
Janine Schweier, Niál T. Perry, Marc Werder, Leo G. Bont
https://doi.org/10.5552/crojfe.2026.4065
Abstract
In some specific yarding situations ground contact needs to be reduced to an absolute minimum. In such cases, a double-hitch system can serve as an alternative to helicopter logging. In the present investigation, a cable yarding operation using double-hitch carriages for selective thinning in intermediate slope was accompanied by a time and motion study to better understand the working steps and resulting productivity of cable yarding in this unconventional situation. The main aims were to develop a model that can be used to estimate the productivity of comparable yarding operations before their implementation, and to quantify the additional effort relative to the use of a cable yarder with a single-hitch carriage. The results indicated an overall productivity of 5.69 m3ob per productive system hour including delays of up to 15 minutes (PSH15), leading to yarding costs of 97.54 CHF (m3ob)-1 (in addition to costs for installation and felling). Compared to a system with a common single-hitch carriage, the inclusion of a second lateral yarding stage increased time and cost, contributing 13.30 € (m3ob)-1. Key factors affecting productivity were payload size, number of load pieces, and terrain difficulty, while yarding distances had minimal impact. Compared with traditional yarding, double-hitch operations were less productive and more costly, but they can still be considered a suitable alternative to helicopter logging in sensitive areas.
Keywords: forest operation, productivity analysis, reduced-impact logging, time study, tower yarder
1. Introduction
Cable-based systems are usually applied in steep terrain, where ground-based systems cannot operate (Böhm and Kanzian 2023). They represent the most common harvesting method on steep slopes, and there are numerous manufacturers offering diverse systems and machines (Spinelli et al. 2021b, Böhm and Kanzian 2023). Globally, various systems are currently in use (Varch et al. 2021). The development of yarder types and yarding practices is the result of different silvicultural restrictions and philosophies (Bont and Church 2018). Under the clear-cut forest management widespread in North America and the Southern Hemisphere, developments have tended towards large, tall and powerful yarders with running skyline configurations (Visser and Harril 2017). In contrast, in Central Europe, relatively small but highly mobile machines with standing skyline configurations (fix-spanned skyline at both ends) have been developed (Heinimann et al. 2001), tailored for logging in thinning cuts and in single-tree or group selection cuts (Bont et al. 2022). In these kinds of operations, it is of absolute importance that the vertical deflection of a skyline remains within acceptable limits to ensure enough ground clearance, in order to control the movements when logging the wood and thus prevent damage to the remaining stand. Less common, but in special situations cable yarders can also be applied in non-steep terrain, such as with sensitive soil (Erber and Spinelli 2020, Schweier and Ludowicy 2020, Schweier et al. 2023, 2024), usually referred to as yarding in horizontal direction.
In a few cases, the use of a double-hitch system can become necessary to prevent trees from contacting the ground (Spinelli et al. 2023). Such cases apply for example in soil-sensitive terrain, or when a valley needs to be crossed. In this case, the load is connected to carriages at both ends using chokers (Ghaffariyan 2023), which means that the double-hitch suspension requires a »double carriage«, composed of two separate elements working in tandem, each with its own lift line (Spinelli et al. 2021a) (Fig. 4 and 5). There have been few studies focusing on such systems, mainly recent work by Spinelli et al. (2021a, 2021b, 2023). To learn from experiences, counter-balance peculiarities, and generate a broader data basis, more individual cases need to be analyzed. To help address this gap, in the present work, a cable yarding operation in Switzerland using double-hitch carriages in intermediate slope for selective thinning was accompanied by a time and motion study to better understand the working steps and resulting productivity of cable yarding in this unconventional situation.
The main objective was to better understand and describe the work processes. More specifically, the aims were:
to develop a model that can be used to estimate the productivity of comparable yarding operations before their implementation
to quantify the additional effort required relative to the use of a cable yarder with a single-hitch carriage.
2. Materials and Methods
2.1 Motivation and Framework
The yarding operation using double-hitch carriages was conducted in October 2023 in the canton of Lucerne in central Switzerland. The public forest owner was motivated to select a contractor offering this harvesting method for three reasons. First, the intervention was conducted to promote the habitat of the capercaillie located there. Second, the forest stand was a very wet site with many small streams, gullies, and ravines that were not to be impacted by the logging operation. Third, the operation was carried out in an area important for hiking. The person in charge aimed to apply a harvesting method that would limit damage to the soil and the remaining stand (Spinelli et al. 2023) while meeting all other requirements. The total harvested volume was 860 m3ob; however, the double-hitch system was applied on parts of this area only, more specifically to extract 110 m3ob. Fig. 1 shows the location of the operation and provides information about the position, length, and inclination of the cable corridor.
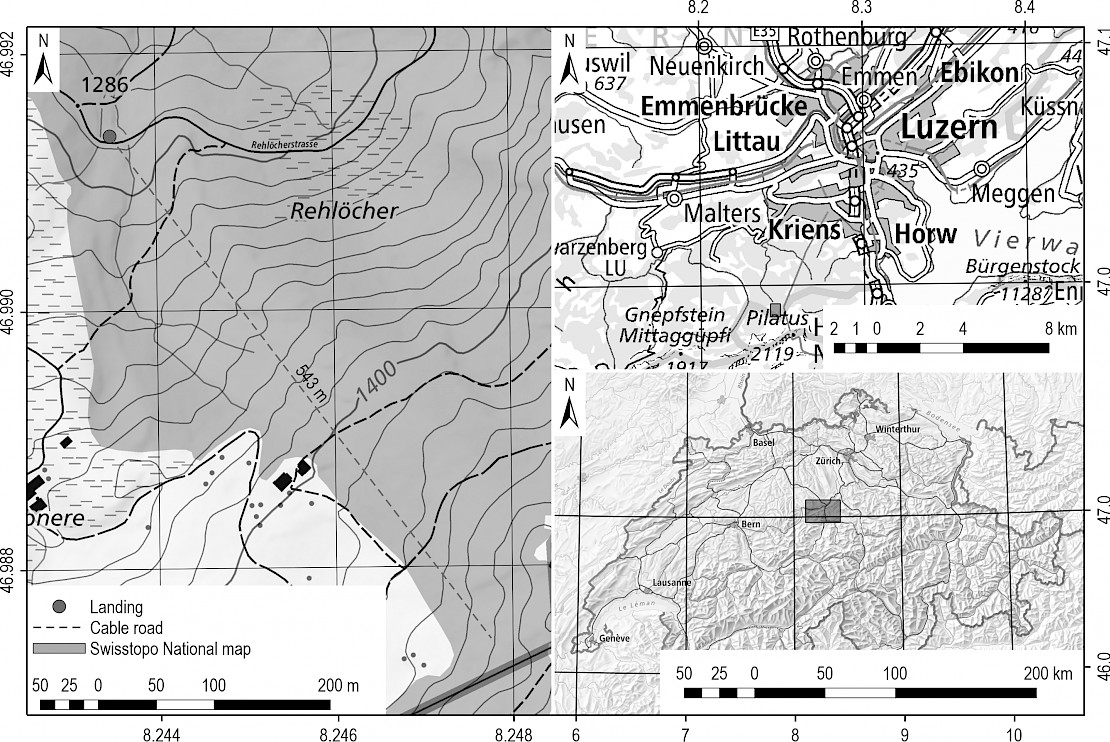
Fig. 1 Position and length of the cable road at the study site, overlaid on a topographic map (left); location of the study site in the Swiss canton of Lucerne (top, right); and location of the study site within Switzerland (bottom, right). Maps reproduced with permission from Swisstopo (JA100118). Coordinate system: EPSG 4326 – WGS 84
2.2 Forest Classification
Two forest types are present in the study site: horsetail-spruce-fir (Equiseto-Abieti-Piceetum typicum) and tall herb-spruce-fir forests (Adenostylo-Abieti-Piceetum). The former is a mesic forest type with spruce (Picea abies) and fir (Abies alba), dominated by acidic summits, with secondary species like sycamore maple (Acer pseudoplatanus) and grey alder (Alnus incana) appearing in wetter areas. The shrub layer is sparse, and the soil is poorly drained, posing a risk of compaction. The latter forest type is similar but includes tall herbs in the understory, potentially hindering tree regeneration. Both forest types are of great importance as habitat for the capercaillie. Fig. 2 provides images of the study site and the streams, ditches, and other obstacles that made a ground-based operation unsuitable.
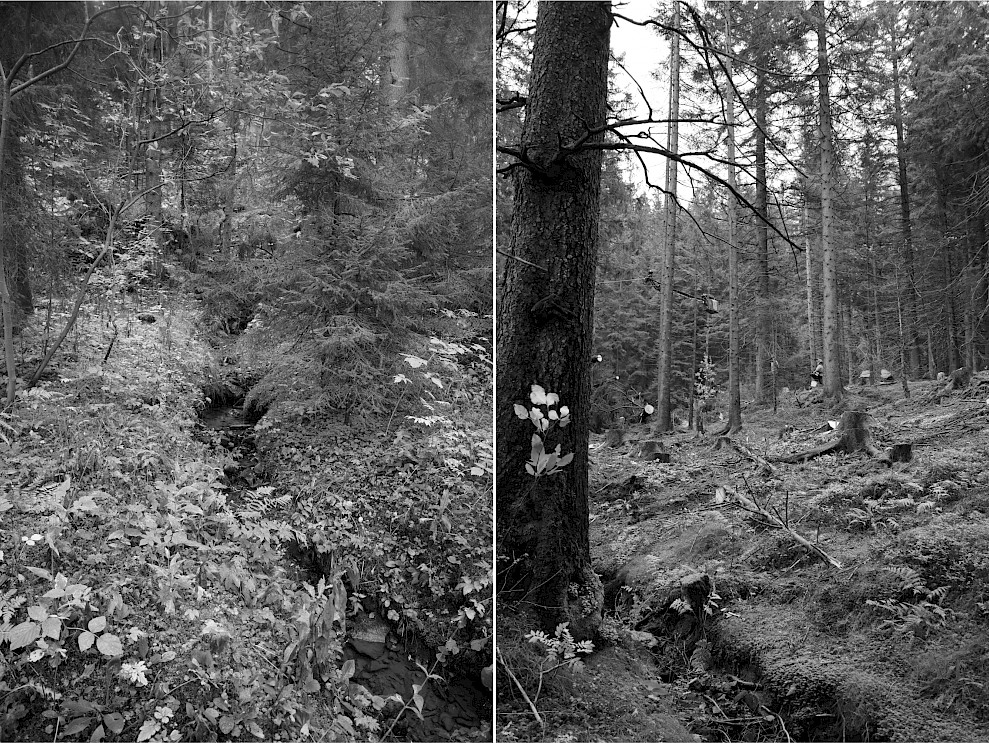
Fig. 2 Small streams, ditches and other obstacles at the case study site, complicating the logging operation (image credit: Schweier/WSL)
2.3 Forest Operation
Planning and felling
The selective thinning was planned by the local forester and pre-discussed with the contractor. Trees were medium-sized with dominant DBH of 41–50 cm. The stocking volume of the stand was 400 m3 ha-1 before and 280 m3 ha-1 after the intervention. The last selective harvesting was conducted 25 years ago.
Motor-manual felling with whole-tree logging was applied (Kellogg et al. 1993) unless the trees were too large, in which case trees were cut into two or three pieces before yarding. The harvested species consisted of Norway spruce (Picea abies, 95%) and silver fir (Abies alba, 5%). During the yarding operation, the workers realized that some trees were too close to the cable corridors, preventing the carriage from passing with a load. Consequently, some additional trees were felled in the first two days of yarding.
Cable corridor
The cable corridor was 543 m long, of which only 490 m were drivable. Initially, it was planned with three intermediate supports, but another intermediate support had to be installed due to insufficient carriage height in the middle of the cable corridor. In total, approx. 75 m in altitude had to be overcome, resulting in a slope of less than on average 15%. The yarding direction was slightly downhill.
Yarding machines
The contractor used a system that included a tower yarder (Type K507, Koller Forsttechnik GmbH, Austria) with a mounted processor (Type Woody 60, Konrad Forsttechnik GmbH, Austria), both installed on a truck (Fig. 3). The slack-pulled »double carriage« (Fig. 4) was an own development by the contractor.
Yarding process
Approximately 90% of the trees were located within a 5-m lateral yarding distance, while in two cases the distance was more than 10 m. Trees were typically felled with the thick end facing the skyline and the thin end positioned uphill at an angle of approx. 45°. The carriages stopped near the thick end, which was then attached to the chokers of carriage 1. The carriages continued moving uphill until the tree/load turned and was pulled below the skyline. At this point, the other end of the tree/piece was attached to the chokers of carriage 2 and then lifted, and the entire system was sent downhill to the yarder. Fig. 5 shows the carriage in use. In some cases, trees had to be felled downhill. In those cases, the procedure remained the same: first, the thick end was pulled uphill until the tree turned, and then the other end was attached to the second carriage and lifted.
In another scenario observed, trees were felled parallel to the cable line and both ends were attached simultaneously, reducing the time required for the second lateral yarding stage.
Depending on the size of the felled trees, either one or two trees were yarded (further splitting into one to two loads each).
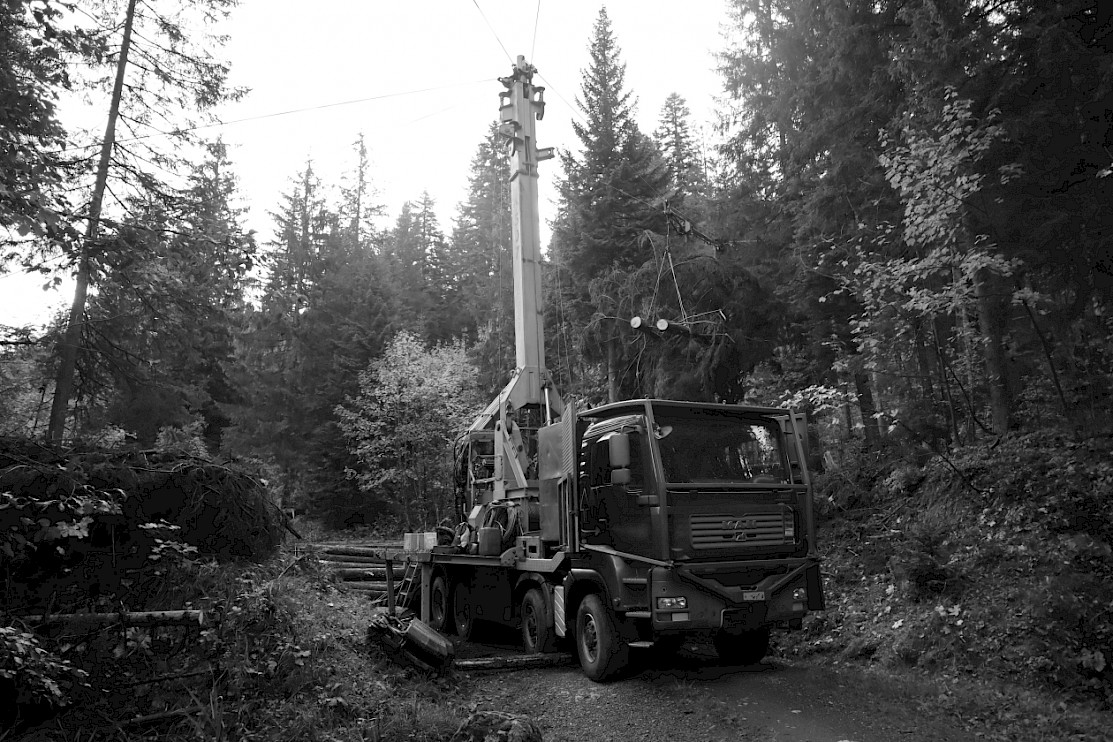
Fig. 3 Koller tower yarder with a mounted processor installed on a truck (image credit: Schweier/WSL)
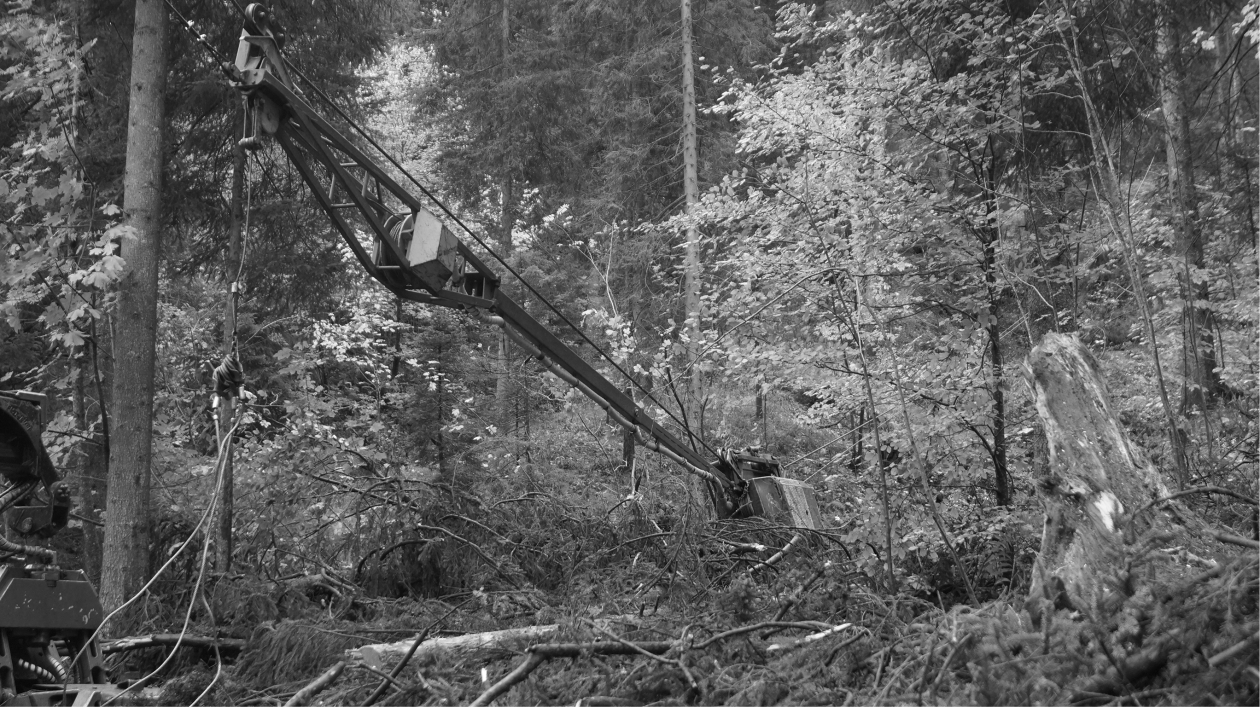
Fig. 4 Contractor-developed double-hitch carriage (here: not in use) (image credit: Schweier/WSL)
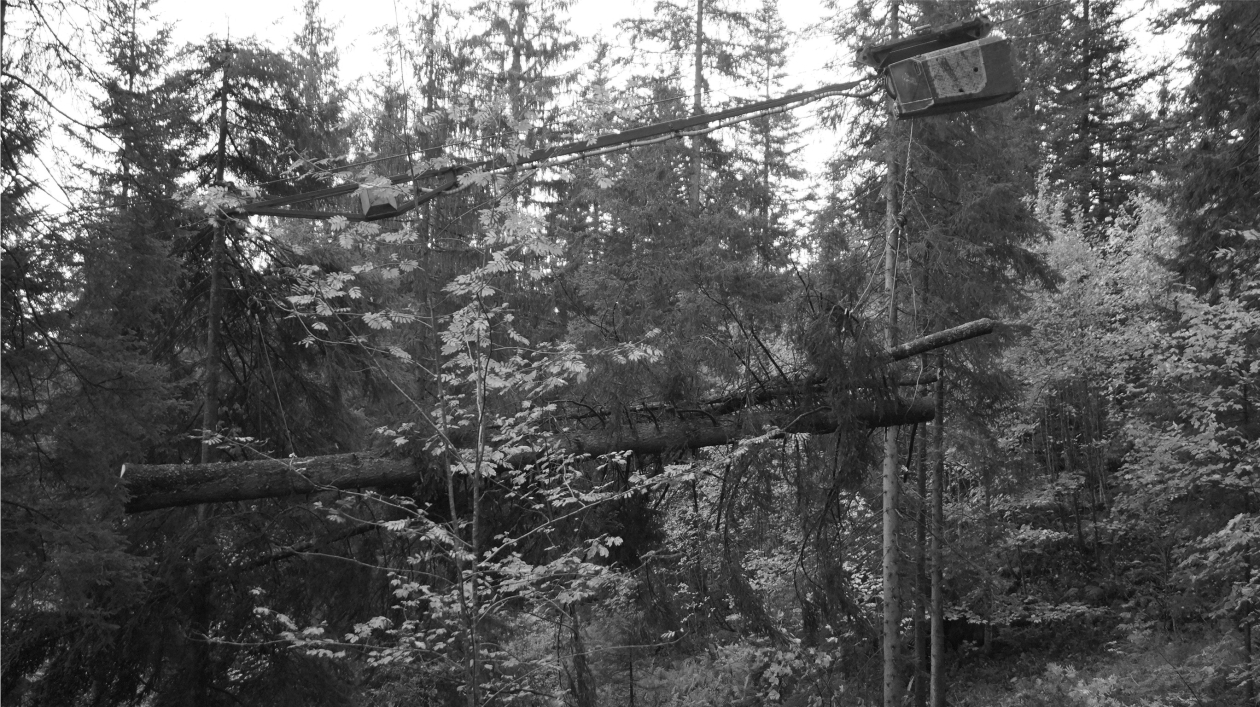
Fig. 5 Double-hitch carriage in use. The end of the tree/piece shown uphill/right is attached to the carriage we call »carriage 1«, while the end of the tree/piece shown downhill/left is attached to what we call »carriage 2« (image credit: Schweier/WSL)
2.4 Data Collection
The yarding operation was accompanied by a team of two researchers conducting a time and motion study. Both were equipped with a chronometer and took notes by hand on paper. A walkie-talkie was used for communication. One researcher observed the processor and carriage at the forest road, while the other observed the forest workers attaching the trees/pieces at the choker in the forest stand. Thus, the total time (TT) of the operation was determined, including processing and yarding. The total study duration was 29.3 hours.
One yarding cycle was defined as the period from when the carriage left the tower yarder processor for the i-th time to when the carriage left the tower yarder processor for the (i+1)th time. All variables needed to assess productivity were measured (Table 1). To better understand the use of the double-hitch carriage, a particular focus was set on lateral yarding. Its distances were measured manually. The terrain difficulty during lateral yarding (easy, medium or hard) was visually evaluated based on the researchers' personal experience, considering microtopography, regeneration/ground cover, stand density, block overlays, and slope. Since 90% of the trees were located within a 5-m radius, distance was not considered a factor affecting the lateral yarding difficulty. Regarding timber volumes, the machine operators read the values in the display of the board computers based on the processors' measurements and reported them for each work cycle via radio.
Table 1 Analyzed predictors of productivity response variables
|
Predictor |
Label |
Unit |
Description |
|
Yarding distance |
yard_dist |
m |
Distance between yarder processor and carriage |
|
Lateral yarding distance |
latyard_dist |
m |
Distance from trees/pieces to the skyline, measured at a right angle |
|
Lateral yarding difficulty |
latyard_diff |
k=low m=medium v=high |
Lateral yarding difficulty due to terrain (considering microtopography, regeneration/ground cover, stand density, block overlays, and slope gradient) represented with indicator variables for the different levels (with k as reference) |
|
Pieces per cycle |
load_pieces_no |
no. |
Number of trees/pieces per cycle |
|
Payload |
payload |
m³ob |
Volume per cycle |
|
Average piece volume |
avg_piece_volume |
m³ob |
Average volume per tree/piece |
2.5 Production Costs
Effective costs of the yarding machine and the forest workers were reported by the involved parties. However, to facilitate comparison, costs were not presented in Swiss Francs, but in euros (€). One € corresponds to 1.16 US Dollar (29 Oct. 2024).
2.6 Determination of Productivity
The following yarding operation times were recorded for each cycle:
Productive yarding time (yard_prod_t): one cycle begins when the carriage starts moving away from the tower yarder processor, and it ends when the carriage returns to the tower yarder processor and stops moving. Lateral yarding time and delays of up to 15 min are included
Yarding waiting time (yard_wait_t): begins when the carriage stops at the tower yarder processor and ends when the carriage starts moving away from the tower yarder processor. Waiting times are caused by unloading or waiting until the processing is finished. Unloading was managed by the tower yarder operator, who released the choker via radio. This task was typically quick, except when processing was still underway, causing delays in releasing the chokers.
Total yarding time (yard_tot_t): is the sum of the productive yarding time and the yarding waiting time
First lateral yarding time (latyard1_t): begins when the carriage arrives to the stand. One end of the tree/piece is attached, lifted, and pulled uphill until it is under the skyline or close to it and the carriage stops. Lateral yarding 1 finishes when the carriage stops
Second lateral yarding time (latyard2_t): begins when the carriage has stopped. At this point, the other end of the tree/piece is attached, lifted, and ready for yarding. Lateral yarding 2 finishes when the carriage starts moving again towards the tower yarder processor
Total lateral yarding time (latyard_tot_t): is the sum of the first and second lateral yarding times (this value was used to compute our response variable of lateral yarding productivity)
Productivity was defined as the volume (m³ob) extracted per productive system hour (PSH15), which »expresses that the output is related to the productive time of the whole yarding system instead of the machine only« (Böhm and Kanzian 2023), including delays of up to 15 min. The overall yarding productivity for the whole operation was calculated as shown in Eq. 1:

Where:
i=1,…,n cycles in the processed data
Table 2 shows the predictors and productivity response variables that were derived for model building. Analyses were conducted to determine if the predictors had a significant impact on the response variables, thus explaining productivity.
Table 2 Productivity response variables, expressed as cubic meters over bark extracted per productive machine hour (m³ob PSH15-1). yard_prod_t: productive yarding time; yard_tot_t: total yarding time; latyard_tot_t: total lateral yarding time
|
Response variable |
Label |
Formula |
|
Productive yarding productivity |
yard_prod_prod |
payload * yard_prod_t-1 |
|
Total yarding productivity (including delays) |
yard_tot_prod |
payload * yard_tot_t-1 |
|
Lateral yarding productivity |
latyard_prod |
payload * latyard_tot_t-1 |
2.7 Statistical Analysis of Operational Productivity
Prior to the modelling of any productivity measures, the raw dataset was cleaned. Histograms of the data were investigated to ensure there were no anomalously large or small values. Every potential outlier was inspected by the researcher who had made the field measurements. Then, cycles with incomplete data, yarding distance = 0, without a load, or missing the lateral yarding or yarding time were removed. Finally, all cycles with delays longer than 15 min were removed. This resulted in a reduction from N=115 to N=95 cycles.
2.8 Model Selection and Assessment
The procedure for model selection and assessment was the same as described in detail in a previous publication (Schweier et al. 2023). In short, ordinary least squares (OLS) regression models were used to estimate productivity. The fitted models were then simplified by performing variable selection based on the Akaike information criterion (AIC; Akaike 2011). Finally, the models were assessed based on their adjusted R2 and the root mean square error (RMSE) from leave-one-out cross-validation (LOOCV).
2.9 Fitting of Productivity Models
Productivity models were fitted for the following processes (see Table 6 for a complete overview):
total productivity of a complete cycle (yard_tot_prod)
yarding productivity if only productive time is considered (yard_prod_prod)
lateral yarding productivity (latyard_prod).
Models were fitted without labourer as a predictor variable because each task was carried out by a single individual, and task assignments remained constant throughout the operation. The predictors included in each model are shown in Table 3. All models were fitted with a log-transformed response variable and mainly also with log-transformed predictors (yard_dist, avg_piece_volume, payload and load_pieces_no were log-transformed). Models with untransformed response and predictor variables showed problems in the model diagnostics. Fig. A1 in the Appendix shows an example of how log-transforming the response variable made the residuals conform more to the linear regression requirements.
Table 3 Model overview with response variable, predictors, and key properties. The models are written in the following way in R (example for model 1): log(yard_tot_prod) ~ latyard_dist + latyard_diffm + latyard_diffv + log(yard_dist) + log(avg_piece_volume) + log(payload). The following significance codes apply: »***« = 0–0.001; »**« = 0.001–0.01; »*« = 0.01–0.05; ».« = 0.05–0.1; »( )« = 0.1–1. Every predictor where the corresponding table entry is not »–« was included in the model shown in that row. For variable explanations see Table 1
|
Response variable |
Model code |
latyard_dist |
latyard_diffm |
latyard_diffv |
log(yard_dist) |
log(avg_piece_volume) |
log(payload) |
load_pieces_no |
log(load_pieces_no) |
Adjusted R-squared |
RMSE absolute (incl. backtransformation) |
RMSE, % (incl. backtransformation) |
N |
Proposed for predictive use |
|
log(yard_tot_prod) |
1 |
() |
() |
* |
. |
*** |
*** |
– |
– |
0.8485 |
1.228 |
20.026 |
95 |
– |
|
2 |
() |
() |
* |
. |
– |
*** |
– |
*** |
0.8485 |
1.258 |
20.516 |
95 |
– |
|
|
3 |
() |
() |
* |
() |
– |
*** |
*** |
– |
0.8515 |
1.255 |
20.455 |
95 |
– |
|
|
1 with AIC |
– |
() |
** |
. |
*** |
*** |
– |
– |
0.8498 |
1.256 |
20.473 |
95 |
– |
|
|
2 with AIC |
– |
() |
** |
. |
– |
*** |
– |
*** |
0.8498 |
1.256 |
20.473 |
95 |
✓ |
|
|
3 with AIC |
– |
() |
* |
() |
– |
*** |
*** |
– |
0.8526 |
1.256 |
20.474 |
95 |
– |
|
|
log(yard_prod_prod) |
4 |
() |
() |
* |
* |
*** |
*** |
– |
– |
0.8174 |
1.793 |
24.173 |
95 |
– |
|
5 |
() |
() |
* |
* |
– |
*** |
– |
*** |
0.8174 |
1.793 |
24.173 |
95 |
– |
|
|
4 with AIC |
– |
() |
** |
* |
*** |
*** |
– |
– |
0.8184 |
1.797 |
24.226 |
95 |
– |
|
|
5 with AIC |
– |
() |
** |
* |
– |
*** |
– |
*** |
0.8184 |
1.797 |
24.226 |
95 |
✓ |
|
|
log(latyard_prod) |
l6 |
() |
*** |
*** |
() |
*** |
*** |
– |
– |
0.5707 |
12.424 |
53.121 |
95 |
– |
|
7 |
() |
*** |
*** |
– |
*** |
*** |
– |
– |
0.5756 |
12.266 |
52.445 |
95 |
– |
|
|
8 |
() |
*** |
*** |
– |
– |
*** |
– |
*** |
0.5756 |
12.266 |
52.445 |
95 |
– |
|
|
6 with AIC |
– |
*** |
*** |
– |
*** |
*** |
– |
– |
0.5721 |
12.167 |
52.021 |
95 |
– |
|
|
7 with AIC |
– |
*** |
*** |
– |
*** |
*** |
– |
– |
0.5721 |
12.167 |
52.021 |
95 |
– |
|
|
8 with AIC |
– |
*** |
*** |
– |
– |
*** |
– |
*** |
0.5721 |
12.167 |
52.021 |
95 |
✓ |
3. Results
3.1 Distribution of Working Time
Overall, 72% of the TT was spent on yarding, and 28% on processing the logs. Specifically, 22% of the TT was spent on lateral yarding, which was included in the total yarding time (Table 4). The second lateral yarding stage accounted for 39% of the lateral yarding time, corresponding to 8.6% of the TT (Table 4).
Table 4 Distribution of the total time (TT) of the forest operation, expressed as absolute values (h) and relative amounts (%). Lateral yarding is included within the yarding time and is divided into the first and second lateral yarding stages
|
Distribution of time |
Absolute time, h |
Relative time, % |
|
Total time |
29.3 |
100.0 |
|
Yarding |
21.1 |
72.0 |
|
Lateral yarding |
6.4 |
22.0 |
|
Lateral yarding stage 1 |
3.9 |
13.4 |
|
Lateral yarding stage 2 |
2.5 |
8.6 |
|
Processing |
8.2 |
28.0 |
The time spent on one yarding cycle was 9.50±2.68 min PSH0-1, corresponding to 11.35±3.13 min PSH15-1. The average payload per cycle was 1.08 m³ob, with an average load consisting of 2.44 trees/pieces. The lateral yarding distance was 4.17 m on average.
Since lateral yarding is of particular interest, Table 5 provides more detailed information: 136 s (mean value per cycle) were spent on the first lateral yarding stage, and another 87 s (mean value per cycle) were spent on the second lateral yarding stage. This time effort for the second lateral yarding stage corresponds to a mean of 80.56 s m3ob-1 or ~64% extra time relative to just the first attachment stage.
Table 5 Average time in seconds (s) per lateral yarding stage, with the second stage separated by difficulty
|
Lateral yarding stage |
Mean, s |
Standard deviation, s |
|
First |
136 |
84 |
|
Second |
87 |
101 |
|
easy terrain |
59 |
71 |
|
medium / hard terrain |
137 |
124 |
The time required for lateral yarding was influenced by its overall difficulty. When it was perceived as »easy«, the average time was less than half that when it was perceived as »medium« or »hard«. Terrain difficulty was considered »easy« in 63% of observations, »medium« in 32%, and »hard« in the remaining 5%.
3.2 Productivity
The yarding productivity, defined as the total amount of payload transported divided by the sum of the total yarding time (which includes the lateral yarding time), was 5.69 m3ob PSH15-1. More detailed analyses are presented in the following sub-sections.
3.2.1 Total Yarding
The predictors latyard_diffv and log(payload) were significant for all three models of total yarding productivity, and the predictors log(avg_piece_volume), log(load_pieces_no), and load_pieces_no were highly significant for models 1, 2, and 3, respectively. These three models performed well, with adjusted R2 values between 0.8485 and 0.8515 and LOOCV RMSE values of about 20%. When the stepwise AIC procedure was applied, predictor latyard_dist was dropped in all three cases.
To show the effect of the individual predictors on productivity, a model effect plot was created. To visualize the effect of a particular predictor, the value for that predictor was varied while all other predictors were fixed at their mean values. The model effect plot for model 3, which closely resembles those for models 1 and 2, is shown in Fig. 6. The plot shows that payload played a particularly large role in determining the productivity of a complete cycle.
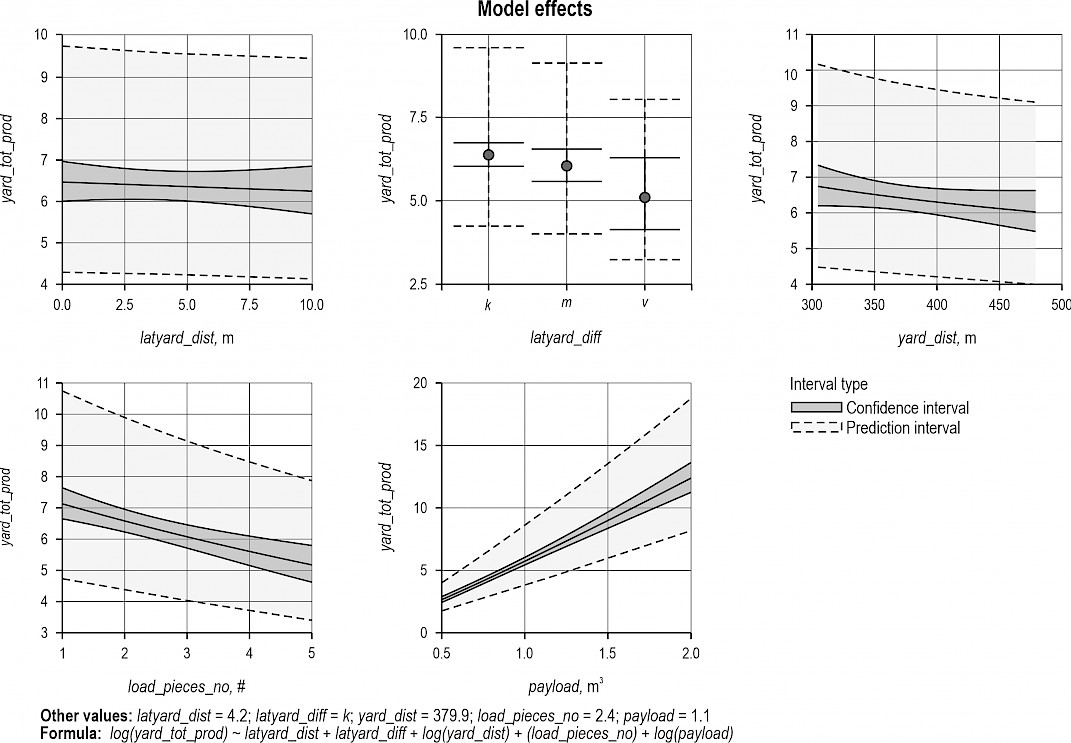
Fig. 6 Model effect plots for model 3, with the productivity of a complete cycle (yard_tot_prod) (m³ob PSH15-1) as the response variable and lateral yarding distance (latyard_dist), lateral yarding difficulty (latyard_diff), yarding distance (yard_dist), average piece volume (avg_piece_volume), and payload (payload) as predictors
Model 2 with AIC (Table 6) is recommended for use in predicting the total yarding time. The AIC models were preferable to the non-AIC ones because the AIC models sensibly excluded latyard_dist, a non-significant predictor. Choosing between the AIC models was difficult because they had similar performance scores. However, model 2 was preferred because it assigned a greater significance to latyard_diffv and included the predictor load_pieces_no, which domain knowledge suggests is more associated with productivity than avg_piece_volume.
3.2.2 Productive Yarding
Coefficient estimates and the significance of the corresponding predictors were nearly the same for productive yarding time as for the total yarding time, with the exception that log(yard_dist) was only significant at the 5% level in the model for productive yarding time. Model 5 with AIC (Table 6) is recommended for predictive use because it excluded the redundant variable latyard_dist without compromising on performance indices relative to the other models, and because it included load_pieces_no, which is favoured over avg_piece_volume. Model effect plots are similar to Fig. 6 and hence omitted.
3.2.3 Lateral Yarding
For all three models of lateral yarding productivity, the predictors latyard_diffm, latyard_diffv, log(payload), and whichever of log(avg_piece_volume) or log(load_pieces_no) was included, were found to be highly significant. Meanwhile, the predictors latyard_dist and log(yard_dist) (in model 6) were not significant. The AIC procedure excluded both insignificant predictors wherever they were present. Model 8 with AIC (Table 6) is recommended for predictive use for a similar reason as above: While all the AIC models excluded non-significant predictors and exhibited a similar model performance, model 8 included load_pieces_no, which is intuitively more closely associated with time consumption for lateral yarding than avg_piece_volume.
Fig. 7 displays the model effect plot for model 8. Lateral yarding productivity was estimated to drastically decrease as lateral yarding difficulty increased. Increasing the payload or decreasing the number of trees/pieces were also estimated to improve productivity, while the flat line for latyard_dist indicates its predicted lack of effect.
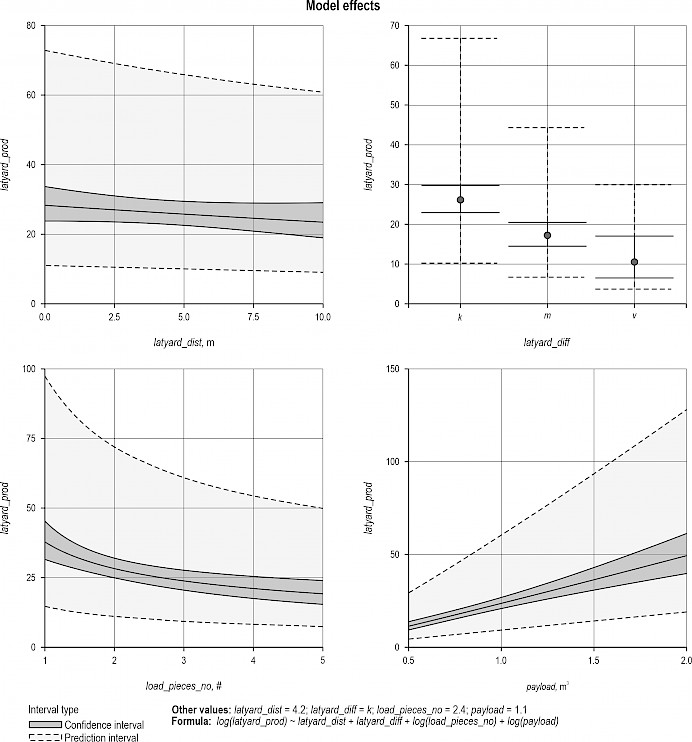
Fig. 7 Model effect plot for model 8, with lateral yarding productivity (latyard_prod) (m³ob PSH15-1) as the response variable and lateral yarding distance (latyard_dist), lateral yarding difficulty (latyard_diff), number of pieces in the load (load_pieces_no), and payload (payload) as predictors
Table 6 Formulae and coefficient estimate of the models recommended for predictive use are provided for total productivity, productivity excluding delays, and productivity of the lateral yarding stage. Variables are defined in Tables 1 and 2
|
Model |
Model formula with coefficients |
Remarks |
|
2 with AIC |
yard_tot_prod = exp(β0 – 0.26617864 * log(yard_dist) - 0.18082473 * log(load_pieces_no) + 1.10960034 * log(payload)) |
β0 = 3.44369232 for latyard_diff == ‘k'; β0 = 3.387604 for latyard_diff == ‘m'; |
|
5 with AIC |
yard_prod_prod = exp(β0 - 0.40869673 * log(yard_dist) |
β0 = 4.47182928 for latyard_diff == ‘k'; β0 = 4.425317 for latyard_diff == ‘m'; |
|
8 with AIC |
latyard_prod = exp(β0 - 0.4165648 * log(load_pieces_no) |
β0 = 3.4227411 for latyard_diff == ‘k'; β0 = 3.018357 for latyard_diff == ‘m'; |
3.3 Costs
The yarding machine ran at a cost of 342 € PSH15-1, and a total of three workforces were required (one very skilled worker at 91 € h-1 leading the operation, one skilled worker at 77 € h-1, and a machine operator at 83 € h-1), resulting in costs of 594 € PSH15-1. Considering that the overall productivity was 5.69 m3ob PSH15-1, costs amounted to 104.40 € m3ob-1 (excluding felling and installation times). The average cost associated with the second lateral yarding stage was 13.30 € m3ob-1.
4. Discussion and Conclusion
Based on the data from the time and motion study, models were developed for three different measures of productivity: the productivity of the whole yarding operation – with and without delays, and the productivity of the lateral yarding component of the operation. The models can be used to estimate the productivity of comparable future operations. Additionally, they highlight which variables are most relevant for a productive operation.
To avoid potential confounding effects caused by variability in processing time, yarding productivity was analyzed using a clearly defined yarding cycle—from the departure of the carriage at the processor tower yarder to its return—excluding any waiting or processing-related delays. Waiting time at the tower yarder processor, which can result from an imbalance between yarding and processing capacities, was recorded separately as yarding waiting time (yard_wait_t). As such, yarding-specific productivity indicators (e.g., yard_prod_t, yard_prod_prod) are unaffected by processing variability. However, in aggregate metrics such as yard_tot_t or yard_tot_prod, which include waiting time, a confounding effect due to processing delays is acknowledged. To conclude, the potentially confounding effect of processing time variability on yarding-specific performance indicators was methodologically controlled and excluded, except in variables where total productivity (including waiting) was explicitly analyzed.
The results showed that the overall system productivity was only 5.69 m3ob PSH15-1, due to the additional attachment of carriage 2, but likely also due to the challenging environment. In another study involving the same yarder in non-steep, horizontal slope terrain, but with a common single-hitch carriage, productivity was 9.95 m3ob PMH15-1 (Schweier et al. 2023). Spinelli et al. (2023) tested three different yarding modes in which a double-hitch carriage can be operated and reported average productivities of 18.2±7.2 to 24.5±15.4 m³ob PSH0-1. However, they referred to a windthrown area, in which a high harvesting intensity can be assumed. In the present study, the silvicultural intervention consisted of a moderate thinning carried out as selective cut.
The combination of low productivity and high labour costs resulted in yarding costs of 104.40 € m3ob-1. This is considered high, even within the Swiss context, where latest statistical data report average harvesting costs including felling and extraction ranging from 90–130 € m3ob-1 in the Pre-Alps and Alps (Bürgi et al. 2022). Swiss labour costs are among highest in Europe due to the country's high living standards, and labour is identified as one of the largest cost drivers of forest operations (e.g., Spinelli et al. 2015, Bont et al. 2024).
The findings additionally confirmed that the average payload and number of pieces of wood transported per cycle are consistently important factors for total productivity. Here, the average payload (1.08 m3ob) was much lower than in previous operations in the horizontal yarding direction with the same yarder, but with common single hitch carriage (1.64–2.21 m3ob). When more than one tree or load was attached, it was observed that it became further difficult to position the trees/pieces in such a way that they could be attached together at the second lateral yarding stage. Therefore, fewer trees/pieces are likely to be attached per cycle with the double-hitch system.
For lateral yarding productivity, the present study demonstrated that the difficulty of the terrain is also important. As the perceived difficulty of the terrain increased, the lateral yarding productivity dropped significantly. Analyses presented in Fig. 7 confirm that this also applies to the second attachment stage considered in isolation. By contrast, the effects of yarding and lateral yarding distances on the respective productivities were not significant.
As expected, double-hitch yarding was found to be more expensive than previously reported for traditional yarding using one carriage. The double-hitch technique is typically applied in specific situations only, such as in the present case, a sensitive area with small rivers and bridges that needed to be preserved and with important habitat for capercaillie, where impacts should be reduced as much as possible. Other situations where a horizontal double-hitch system might be applied include areas with a valley that needs to be crossed, wet areas where forested peat land needs to be managed, and extremely steep terrain where downhill yarding of whole trees is required. It can be assumed that the corresponding alternative harvesting method would be via helicopter, and the use of a horizontal double-hitch yarding system is clearly cheaper than this option.
One aim of this study was to assess the additional time required for the second lateral yarding stage, i.e., for attaching the load to the second carriage. This was 87 s cycle-1 on average, corresponding to 80.6 s m3ob-1 and 13.30 € m3ob-1. It should be noted that the results had large standard deviations and were influenced by the difficulty of the terrain – the easier the terrain, the faster the lateral yarding stage (Table 5).
The results should be interpreted in light of the small sample size. The ultimate objective of this study was to better understand the overall use of the double-hitch carriage system. In this regard, the investigation offered some interesting insights, even though it was limited to a single case study. While Spinelli et al. (2023) mention that double-hitch yarding is a good way to limit swinging of the load and that the inhaul speed is potentially higher, the opposite was observed here:
Before a load passes an intermediate support, braking must be applied for a longer period compared with a standard (single) carriage, until both carriages have passed over the support. This increases the impact of carriage distance on overall productivity. The more supports there are, the greater this impact becomes
It is dangerous when the trees/pieces thread behind a support tree. Therefore, the supports should be crossed slowly. The load begins to sway sideways, and until it stabilizes, there is a risk of threading if the corridors are narrow. In this context, the double-hitch carriage has an influence: the closer the two suspension points of the two carriages are, the more friction occurs, causing the load to swing sideways. When the bars are 8 to 10 m apart, the load swings less.
Thus, in addition to the costs of the second lateral yarding stage, it seems to be that the yarding process is carried out slower compared to common operations using single-hitch carriages. This results in total additional costs of approximately 16 € m3ob-1 when using double-hitch instead of single-hitch carriages.
In general, it was observed that the main time loss of the double-carriage system relative to a traditional single-carriage one occurred before the load was attached to the chokers; the detachment required only slightly more time for the choker system. Time could be saved in situations where it is possible to fell trees parallel to the cable line, because the two ends can then be attached to the carriages simultaneously. This, however, requires at least two workers for the lateral yarding process.
Acknowledgements
The authors thank the forester for permitting data collection and providing information related to the forest stand; Julian Ziegler for supporting the data collection; as well as to the contractor for support and interest in this analysis.
5. References
Akaike, H., 2011: Akaike's Information Criterion. In: Lovric,. M., (ed) International Encyclopedia of Statistical Science. Springer, Berlin, Heidelberg, 25–25 p.
Böhm, S., Kanzian, C., 2023: A review on cable yarding operation performance and its assessment. Int J For Eng 34(2): 229–253. https://doi.org/10.1080/14942119.2022.2153505
Bont, L.G., Church, R.L., 2018: Location set-covering inspired models for designing harvesting and cable road layouts. Eur J Forest Res 137(6): 771–792. https://doi.org/10.1007/s10342-018-1139-7
Bont, L.G., Ramstein, L., Frutig, F., Schweier, J., 2022: Tensile forces and deflections on skylines of cable yarders: comparison of measurements with close-to-catenary predictions. International Journal of Forest Engineering 33(3): 195–216. https://doi.org/10.1080/14942119.2022.2051159
Bont, L.G., Schweier, J., Temperli, C., 2024: Effect of labour costs on wood harvesting costs and timber provision. Eur J Forest Res 143(2): 393–418. https://doi.org/10.1007/s10342-023-01621-5
Bürgi, P., Müller, A., Pauli, B., Rosset, C., 2024: Forstwirtschaftliches Testbetriebsnetz der Schweiz: Ergebnisse der Jahre 2020–2022 (Swiss forestry test enterprise network: Results from 2020–2022). Bundesamt für Statistik (BFS), Neuchâtel, Switzerland.
Erber, G., Spinelli, R., 2020: Timber extraction by cable yarding on flat and wet terrain: a survey of cable yarder manufacturer's experience. Silva Fenn 54(2): 10211. https://doi.org/10.14214/sf.10211
Ghaffariyan, M.R., 2023: Suitable forestry machines for mechanical fuel load reduction and salvage recovery: a short review. Silva Balcanica 25(1): 87–100. https://doi.org/doi: 10.3897/silvabalcanica.25.e116920
Heinimann, H.R., Stampfer, K., Loschek, J., Caminada, L., 2001: Perspectives on Central European cable yarding systems. In: A forest engineering odyssey. Seattle, Washington, 268–279 p.
Kellogg, L., Bettinger, P., Studier, D., 1993: Terminology of ground-based mechanized logging in the Pacific Northwest. Research Contribution 1. Oregon State University, Corvallis, OR, USA.
Schweier, J., Ludowicy, C., 2020: Comparison of a cable-based and a ground-based system in flat and soil-sensitive area: a case study from Southern Baden in Germany. Forests 11(6): 611. https://doi.org/10.3390/f11060611
Schweier, J., Werder, M., Bont, L.G., 2023: Timber provision on soft soils in forests providing protection against natural hazards: a productivity and cost analysis using the Koller 507 in the horizontal yarding direction in Switzerland. Small-Scale For 22(2): 271–301. https://doi.org/10.1007/s11842-022-09526-8
Schweier, J., Werder, M., Bont, L.G., 2024: Productivity and cost analysis of cable yarding operations in flat terrain in the canton of Aargau in Switzerland. International Journal of Forest Engineering 35(3): 428–443. https://doi.org/10.1080/14942119.2024.2333614
Spinelli, R., Visser, R., Thees, O., Sauter, U.A., Krajnc, N., Riond, C., Magagnotti, N., 2015: Cable logging contract rates in the Alps: the effect of regional variability and technical constraints. Croat J For Eng 36(2): 195–203.
Spinelli, R., Magagnotti, N., Cosola, G., De Francesco, F., Erber, G., Mihelič, M., 2023: Evaluation of different modes for yarding windthrown timber with a double-hitch carriage. Croat J For Eng 44(2): 245–257. https://doi.org/10.5552/crojfe.2023.2051
Spinelli, R., Magagnotti, N., Cosola, G., Grigolato, S., Marchi, L., Proto, A.R., Labelle, E.R., Visser, R., Erber, G., 2021a: Skyline tension and dynamic loading for cable yarding comparing conventional single-hitch versus horizontal double-hitch suspension carriages. International Journal of Forest Engineering 32(sup1): 31–41. https://doi.org/10.1080/14942119.2021.1909322
Spinelli, R., Magagnotti, N., Cosola, G., Labelle, E.R., Visser, R., Erber, G., 2021b: The effect of yarding technique on yarding productivity and cost: conventional single-hitch suspension vs. horizontal double-hitch suspension. Croat J For Eng 42(3): 369–380. https://doi.org/10.5552/crojfe.2021.886
Varch, T., Erber, G., Visser, R., Spinelli, R., Harrill, H., Stampfer, K., 2021: Advances in cable yarding: a review of recent developments in skyline carriage technology. Curr For Rep 7(4): 181–194. https://doi.org/10.1007/s40725-021-00150-x
Visser, R., Harril, H., 2017: Cable yarding in North America and New Zealand: a review of developments and practices. Cro J For Eng 38(2): 210–217.
Appendix A
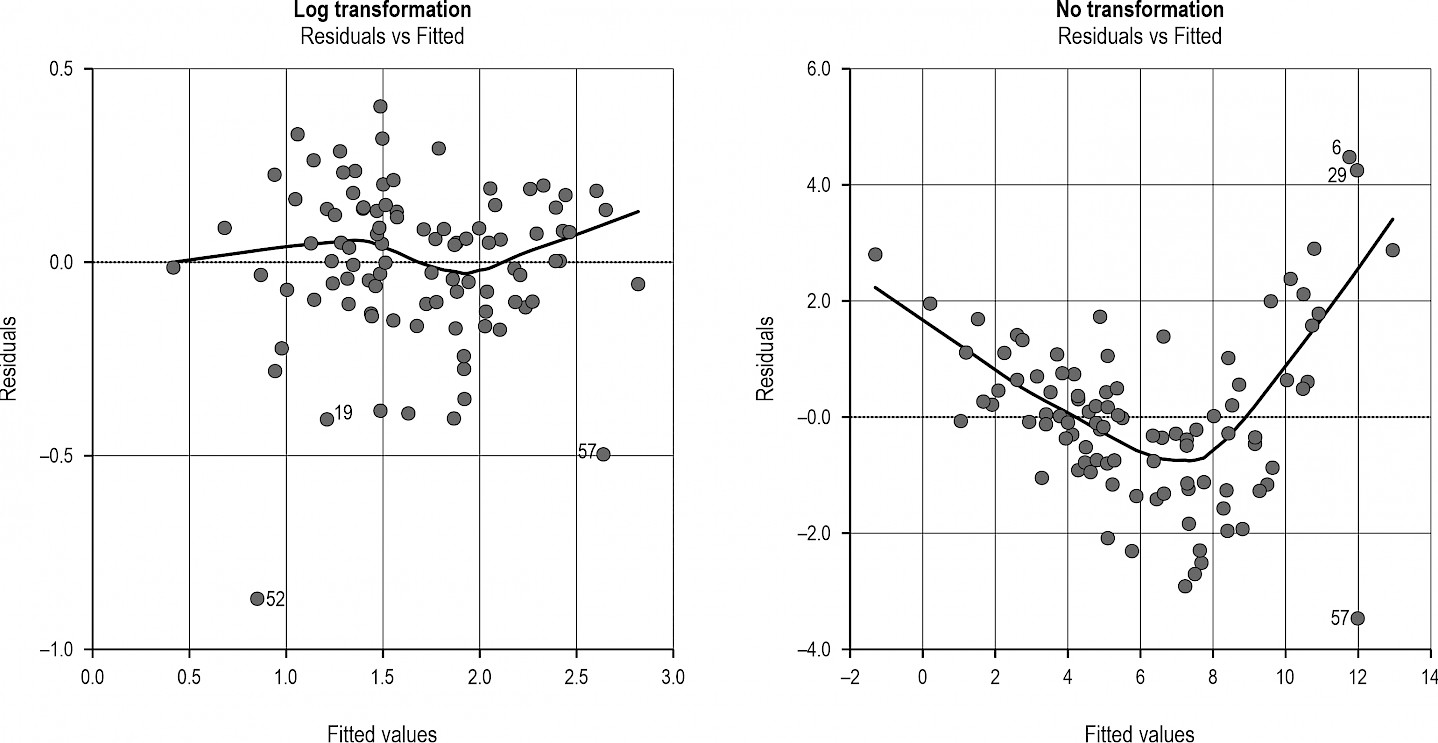
Fig. A1 Illustrative Tukey-Anscombe plots for models with (left) and without (right) a log-transformed response variable
© 2025 by the authors. Submitted for possible open access publication under the
terms and conditions of the Creative Commons Attribution (CC BY) license (http://creativecommons.org/licenses/by/4.0/).
Authors' addresses:
Janine Schweier, Dr. rer. nat. *
e-mail: janine.schweier@wsl.ch
Nial T. Perry, MSc
e-mail: nial.perry@wsl.ch
Marc Werder, BSc
e-mail: n.a. the author was affiliated with WSL when the study was conducted
Leo G. Bont, Dr. Sc. ETH
e-mail: leo.bont@wsl.ch
Swiss Federal Institute for Forest, Snow and Landscape Research WSL
Research Group Sustainable Forestry
Zürcherstrasse 111
8903 Birmensdorf
SWITZERLAND
* Corresponding author
Received: February 24, 2025
Accepted: July 19, 2025
Original scientific paper