
Mitigating Earthwork Deviations in Forest Roads: Field Validation of Traditional vs. DTM-Based Methods
doi: https://doi.org/10.5552/crojfe.2027.4847
volume: issue, issue:
pp: 20
- Author(s):
-
- Topatan Hakan
- Ozturk Tolga
- Article category:
- Original scientific paper
- Keywords:
- forest roads, earthwork optimization, computer-aided volume estimation, digital terrain modeling (DTM), AutoCAD Civil 3D, Pappus-based method, RTK-GNSS, precision forestry, road construction
Abstract
HTML
The accurate estimation of earthwork volume, which constitutes the primary cost driver in road planning and construction, is crucial for project budget management and environmental sustainability. This study conducts a comparative analysis of traditional versus modern estimation techniques along an existing road alignment in the Istanbul University-Cerrahpaşa Research Forest. High-resolution terrain data, acquired via Real-Time Kinematic Global Navigation Satellite System (RTK-GNSS) and Total Station integrated surveys, were used to test the Average End Area, Prismoidal, Simplified Applicable Lengths, and Pappus-based methods utilizing both field-measured and standard template cross-sections. In the context of computer-aided design (CAD) analyses, models incorporating varying cross-section intervals and sampling strategies were generated using AutoCAD Civil 3D, and the resulting volume estimates were subjected to statistical evaluation. Results indicated that calculations based on field-measured cross-sections resulted in a significant »fill deficit«, whereas the use of standard template cross-sections consistently led to a distinct »cut surplus«. Among traditional methods, the Prismoidal and Pappus-based methods produced the most precise results, whereas the widely used Average End Area Method overestimated earthwork volumes. In computer-aided approaches, automatic cross-section sampling based on road geometry and 5-meter fixed interval modeling yielded no statistically significant difference from the reference method – defined as the arithmetic mean of the Average End Area and Prismoidal results at 1 m cross-section intervals in Civil 3D – confirming their reliability. These findings highlight the importance of employing 5-meter interval modeling in CAD environments for optimal alignment selection. Furthermore, the study advocates for the use of the Pappus-based method in traditional calculations due to its consideration of the horizontal curvature effect.
Mitigating Earthwork Deviations in Forest Roads: Field Validation of Traditional vs. DTM-Based Methods
Hakan Topatan, Tolga Öztürk
https://doi.org/10.5552/crojfe.2027.4847
Abstract
The accurate estimation of earthwork volume, which constitutes the primary cost driver in road planning and construction, is crucial for project budget management and environmental sustainability. This study conducts a comparative analysis of traditional versus modern estimation techniques along an existing road alignment in the Istanbul University-Cerrahpaşa Research Forest. High-resolution terrain data, acquired via Real-Time Kinematic Global Navigation Satellite System (RTK-GNSS) and Total Station integrated surveys, were used to test the Average End Area, Prismoidal, Simplified Applicable Lengths, and Pappus-based methods utilizing both field-measured and standard template cross-sections. In the context of computer-aided design (CAD) analyses, models incorporating varying cross-section intervals and sampling strategies were generated using AutoCAD Civil 3D, and the resulting volume estimates were subjected to statistical evaluation. Results indicated that calculations based on field-measured cross-sections resulted in a significant »fill deficit«, whereas the use of standard template cross-sections consistently led to a distinct »cut surplus«. Among traditional methods, the Prismoidal and Pappus-based methods produced the most precise results, whereas the widely used Average End Area Method overestimated earthwork volumes. In computer-aided approaches, automatic cross-section sampling based on road geometry and 5-meter fixed interval modeling yielded no statistically significant difference from the reference method – defined as the arithmetic mean of the Average End Area and Prismoidal results at 1 m cross-section intervals in Civil 3D – confirming their reliability. These findings highlight the importance of employing 5-meter interval modeling in CAD environments for optimal alignment selection. Furthermore, the study advocates for the use of the Pappus-based method in traditional calculations due to its consideration of the horizontal curvature effect.
Keywords: forest roads, earthwork optimization, computer-aided volume estimation, digital terrain modeling (DTM), AutoCAD Civil 3D, Pappus-based method, RTK-GNSS, precision forestry, road construction
1. Introduction
Road planning and construction constitute one of the most complex and resource-intensive processes of engineering works. One of the most critical components in this process is the accurate estimation of earthwork volume, which directly affects the project's success, budget management, and environmental sustainability (Akgül et al. 2018, Liu et al. 2021). Earthwork operations - defined by Hickerson (1967) and Hintz and Vonderohe (2011) as the excavation, haulage, and placement of all types of soil and ensuring the necessary cut-fill balance to reach the design subgrade elevation - constitute the primary cost driver in road projects (Artun et al. 2020). Especially in the construction of low-volume forest roads, earthwork operations account for more than 80% of the total construction cost in steep terrain. Therefore, the precise determination of earthwork volume is a necessity in terms of both managing the project budget and mitigating construction-related environmental impacts (Smith et al. 2000, Kim and Schonfeld 2001, Coulter et al. 2002, Akay 2004, Aruga et al. 2005, Stückelberger et al. 2006, Umeda et al. 2007, Gümüş et al. 2008, Contreras et al. 2012, Pazhouhan et al. 2017, Babapour et al. 2018, Matinnia et al. 2018, Eliou et al. 2019).
Examination of Türkiye's topography reveals that mountainous terrain constitutes approximately 57% of the country's surface area (Görcelioğlu 2003). This topography renders earthwork operations in forest road construction resource-intensive and elevates the criticality of their accurate estimation. According to 2022 data from the General Directorate of Forestry (GDF), the construction of the additional 87,936 km of roads required for the forest road network demands an investment of approximately $1.002 billion, based on the average unit cost of $11,396.92/km calculated by Acar and Karabacak (2012). Assuming that 80% of this budget is allocated to cut and fill works, an earthwork cost volume of approximately $802 million is projected. According to the results of Acar and Karabacak (2012), geotechnical material classes significantly influence costs; in terrains characterized by hard rock (27.16%) and loose rock (27.54%), total excavation costs account for 42.33% and 13.49%, respectively. However, significant discrepancies are frequently observed between pre-tender estimates and as-built quantities. For instance, Gümüş et al. (2015) detected a 31% difference between estimated costs and measurements at the completion of construction. Such deviations can lead to contractual disputes regarding progress payments, unjustified financial gains, or incomplete works (Acar and Karabacak 2012).
In current practice, in accordance with the Communiqué of the General Directorate of Forestry (2008), earthwork volume estimations are generally performed using the Average End Area Method, which relies on the averaging of cross-sectional areas. However, Easa (1988a, 1989, 1992a, b) and Contreras et al. (2012) emphasized that traditional methods are insufficient in mountainous and rugged terrains where slopes are non-uniform, and that ignoring sudden slope changes leads to deviations of up to 7% in earthwork volume estimations (Easa 1988a). To address these limitations, various improvements such as modifications proposed by Epps and Corey (1990), alternative approaches examined by Siyam (1987) and Oloufa (1991), and the weighted ground line method (Goktepe and Lav 2004) have been proposed in the literature. Furthermore, mathematical models such as linear programming and heuristic approaches (Akay 2004), the Tabu Search algorithm and Pappus-based Method (Aruga et al. 2005, Aruga 2005), and Monte Carlo simulation (Easa 2003) have been developed for minimizign costs and optimizing alignment. Additionally, Eliou et al. (2019) examined the applicable lengths method by synthesizing the studies of Karakikes (2012), Gizas (2016), and Gkoutzini (2017).
With technological advancements, the process has been transferred to computer-aided environments to enhance the accuracy of earthwork estimations. Demir (2002), Cheng and Jiang (2013), Melemez et al. (2015), Şentürk et al. (2018) and Artun et al. (2020) digitized estimation processes using software such as InROADS, NetCad, and AutoCAD Civil 3D. Additionally, Tunay et al. (2001), Gümüş et al. (2003), Sulistyo (2007) and Arıcak and Acar (2008) improved spatial analysis capabilities by integrating Geographic Information Systems (GIS) and the isopach method defined by İcifer (1984). In the data acquisition phase, Reutebuch et al. (2003), Contreras et al. (2012), Zhang et al. (2016) and Akgül et al. (2018) used technologies such as LiDAR, RTK-GNSS based Unmanned Aerial Vehicles (UAV) (Siebert and Teizer 2014) and Terrestrial Laser Scanning (TLS) (Slattery et al. 2012). Triangulated Irregular Network (TIN)-based 3-dimensional (3D) models produced via these advanced technologies provide much more precise earthwork volume estimations compared to traditional methods, as also emphasized by Gülci et al. (2021) and Wen et al. (2021).
Beyond economic concerns, the environmental impacts of forest roads constitute an integral component of the planning process. Akay et al. (2007) emphasized that poorly maintained and substandard forest roads represent the primary source of sediment delivery to streams, and that improper slope and drainage practices exacerbate erosion risks. Therefore, accurate earthwork planning is an imperative not only for cost management but also for mitigating environmental impacts.
In light of these challenges, this study evaluates traditional and modern earthwork estimation techniques employed in forest road projects. The primary objectives are to minimize construction costs, resolve discrepancies between tender and progress payment processes, reveal the potential discrepancies arising from deviations in standard cross-section applications, and facilitate environmentally conscious construction practices. Within this scope, the study conducts a comparative analysis of traditional methods versus three-dimensional (3D) volume estimation techniques to identify the most suitable methodology for selecting the optimum road alignment among alternatives.
Unlike previous studies that focus on individual aspects - such as cross-section interval effects using LiDAR or UAV-derived DTMs (Contreras et al. 2012, Akgül et al. 2018), or CAD-based comparisons of specific volume methods (Cheng and Jiang 2013, Şentürk et al. 2018) - this study simultaneously evaluates four traditional earthwork estimation methods, including the application of the Pappus method to low-standard, heavily curved forest roads in mountainous terrain, under two distinct data source scenarios (field-measured versus standard template cross-sections). By validating their performance against a high-precision CAD-based control method, it provides a holistic and multi-dimensional assessment framework for forest road earthwork estimation.
2. Materials and Methods
2.1 Study Area and Data Acquisition
The study was conducted within the Istanbul University-Cerrahpaşa Research and Application Forest, located on the coastal strip of the Thrace section of the Marmara Region (Fig. 1). The research area lies between 28°59’17”–29°32’25” East longitudes and 41°09’15”–41°11’01” North latitudes, with an elevation range of 10 m (Baklalıdere) to 231 m (Büyükdoğan Tepe) (Akgül 2012, Akburak 2013). Forest Road No. 001 was selected for cross-sectional data acquisition (Fig. 2). As base data for the study, forest management plans, road network maps, academic theses, and satellite imagery dated 2021 (Esri, Maxar, Earthstar Geographics) were evaluated. Field surveys were conducted using integrated measurement technologies; terrain coordinates were obtained using RTK-GNSS (Real-Time Kinematic Global Navigation Satellite System) instruments, while terrestrial measurements were carried out using a Total Station and distance meters. The RTK-GNSS instrument (Pentax SMT 888-3G) provided horizontal and vertical accuracies of 10 mm+1 ppm and 15 mm+1 ppm in RTK mode, respectively, while the Total Station (Pentax W 2800 N) achieved a distance measurement accuracy of ±(2+2 ppm × D) mm with a prism target (Baytekin 2022). All measurements were performed in accordance with the standards of Communiqué No. 292 (GDF 2008), ensuring consistency and quality control throughout the field surveys.
The earthwork volume estimations in this study are based on the cross-sections presented in Fig. 2, whose standard geometric elements were adapted from (Bayoğlu 1997, Erdaş 1997, NZFOA 2020). While traditional methods rely on the area-distance relationship, analyses performed with digital terrain models (3D) necessitate high-resolution data reflecting actual terrain conditions, largely due to the accuracy limitations of conventional contour maps (Oloufa 1991).
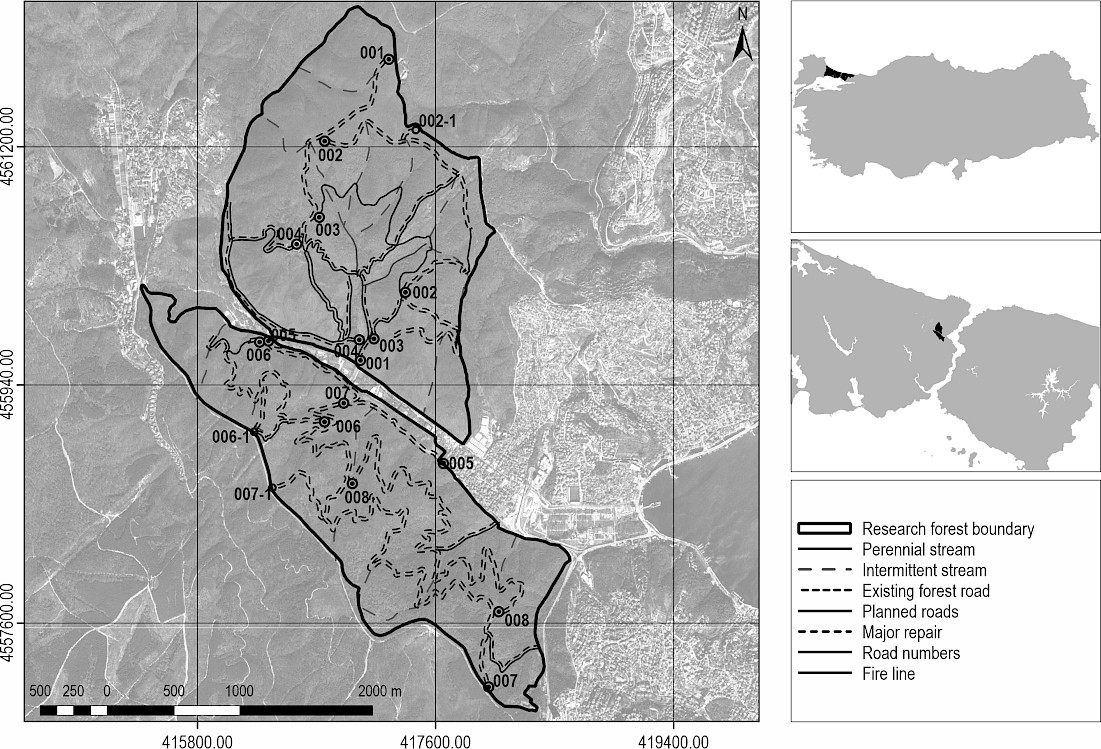
Fig. 1 Geographical location of the research area and the network of existing and planned forest roads
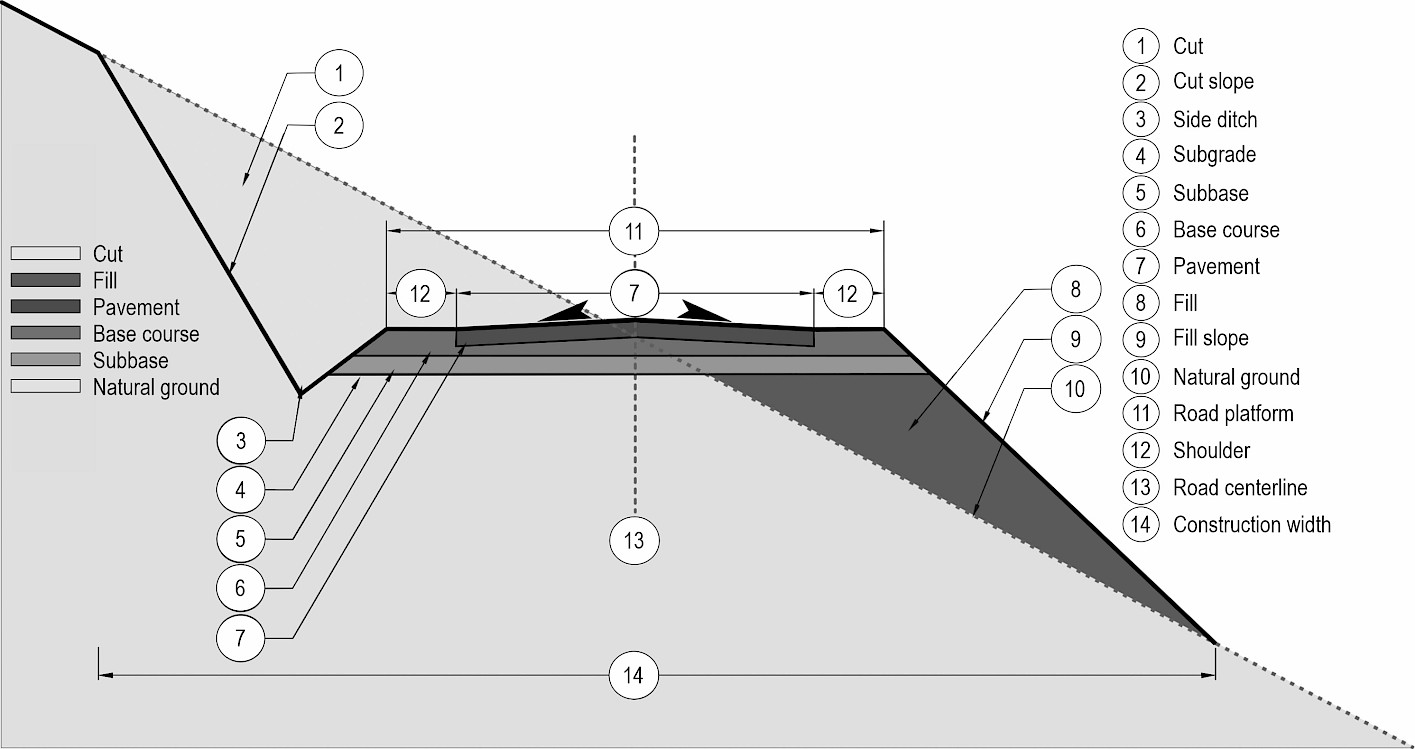
Fig. 2 Standard template cross-section illustrating the geometric elements and pavement layers of a mixed profile
Cross-section spacing is considered one of the most critical parameters determining the accuracy of earthwork estimations (Siyam 1987). While traditional approaches accept intervals of 25 m in tangents and a critical limit of 30 m (Aruga et al. 2005, Contreras et al. 2012, Cheng and Jiang 2013), current studies emphasize that to maximize precision, this interval should be reduced to 20 m in tangents and to 6–10 m in curves where geometric variability is high (Pazhouhan et al. 2017, Akgül et al. 2018, Artun et al. 2020).
Increasing cross-section spacing diminishes the accuracy of earthwork estimations, even when high-resolution Digital Elevation Models (DEM) or detailed ground survey data are used. Conversely, integrating measurements taken at more frequent intervals with high-resolution models yields significantly more precise earthwork volume estimations, despite the increased fieldwork load (Aruga et al. 2005).
Following the road stationing process performed using a distance meter, cross-section locations were determined based on the geometric characteristics of Forest Road No. 001. Measurement points were established at intervals of 20 m in tangent sections and 5–10 m in curves, depending on the radius.
To model existing road conditions for precise earthwork estimations in Autodesk Civil 3D, RTK-GNSS technology which provides high-resolution data in forested areas (Gülci et al. 2015) was integrated with Total Station capabilities based on the principle of combining traditional and modern instruments (Smith et al. 2000). Field surveys were conducted using »Pentax SMT 888-3G« RTK-GNSS and »Pentax-W 2800 N« Total Station devices (Baytekin 2022), in accordance with the standards of Communiqué No. 292 (GDF 2008). The X, Y, Z coordinates of the road centerline, shoulder edges, and slope catch points were recorded in detail using a specific coding system (Akgül et al. 2016) by means of a Total Station established on traverse points, the coordinates of which were acquired via the Turkish National Permanent RTK Network (Gülci et al. 2015) (Fig. 3).
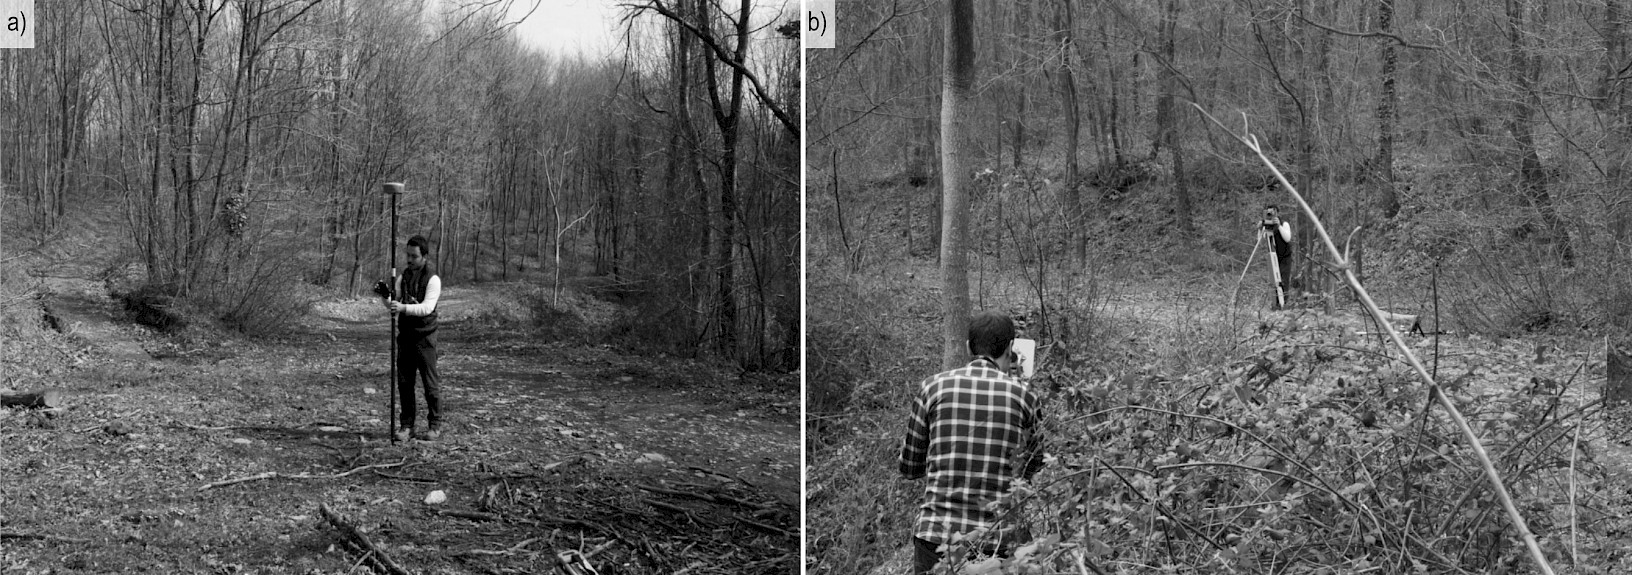
Fig. 3 Acquisition of coordinate data using a) RTK-GNSS and b) Total Station for terrestrial measurements
The cross-sectional data, acquired via the specified coding system, were classified and recorded as follows: natural ground points on the cut side, cut slope catch points, road platform edges (cut and fill sides), the road centerline, fill slope catch points, and natural ground points on the fill side. During the field survey, eight points were measured and coded at each cross-section station according to their position within the cross-section, following the point coding approach described by Akgül et al. (2016) and the standard topographic coding conventions outlined by Kavanagh (2010). These eight points were classified as follows: natural ground on the cut side, top of cut slope, bottom of cut slope, road platform edge on the cut side, road centerline, road platform edge on the fill side, bottom of fill slope, and natural ground on the fill side. Following data import into the CAD environment, the sequentially coded points belonging to the same cross-section station were connected along the cross-section axis to generate the cross-section geometry, thereby identifying the cut and fill catch points.
Following field surveys, the Digital Terrain Model (DTM) production stage was initiated (Şentürk et al. 2018). After performing coordinate and projection transformations, the collected data were superimposed with satellite imagery. Subsequently, earthwork estimations were conducted using two distinct approaches:
- traditional methods based on cross-sections extracted for each station
- computer-aided estimations within the Autodesk Civil 3D environment.
In the latter, surface modeling, horizontal alignment design, longitudinal profile creation, design grade line determination, and standard template cross-section operations were executed. Ultimately, the volume results obtained from both methods were statistically compared using SPSS software.
2.2 Earthwork Volume Estimation Methods
Earthwork and haulage operations constitute the foundation of engineering plans and represent a primary cost driver in road projects (Wanasinghe et al. 2019). To optimize these costs, estimation approaches relying on the differential between existing ground levels and design elevations are widely employed (Artun et al. 2020). These methods operate on the premise that estimation accuracy is directly proportional to data density (Meyer and Gibson 1980, Epps and Corey 1990, Contreras et al. 2012); however, acquiring high-density data via traditional field surveys is traditionally resource-intensive and costly (Contreras et al. 2012).
Given that the accuracy of cross-sectional areas is the primary determinant for earthwork estimations (Easa 1989, Kim and Schonfeld 2001), selecting critical measurement locations is imperative. Measurements must be taken at key points such as the intersections of existing ground and design grade lines, curve points, stream crossings, and property boundaries (Bayoğlu 1996, Demir 2002), as well as at appropriate intervals along the road centerline (Siyam 1987, Bayoğlu 1997, Aruga et al. 2005). Crucially, these measurements must be performed perpendicular to the axis in tangents and radially in curves (Bayoğlu 1997). Regarding design strategy, »mixed cross-sections« that utilize excavated material for fill are economically preferred, particularly in forest roads (Bayoğlu 1997). To compute areas based on natural ground geometry and the standard road template, various methods including the triangle, coordinate, planimeter, and grid methods are employed (Siyam 1987, Evren 1994, Seçkin 2003, Aruga et al. 2005, Hanzhi 2009, Kavanagh 2010, Hintz and Vonderohe 2011, Liu et al. 2021). In this study, following the field survey, the measured cross-section points were imported into the CAD environment, where each cross-section was drawn as a two-dimensional (2D) polygon using the recorded X, Y, Z coordinates. The cross-sectional areas were then calculated individually for each station using the AutoCAD AREA command, which computes polygon areas based on the coordinate method a standard approach in which the area of a closed polygon is derived from the coordinates of its vertices (Siyam 1987, Kavanagh 2010, Liu et al. 2021). The accuracy of AutoCAD-based cross-sectional area calculations is an accepted reference in forest road research (Babapour et al. 2018).
Earthwork volume estimation constitutes the final stage of the planning process, directly determining grading costs and the cut-fill balance (Evren 1994). Although the literature documents various methodologies including the Average End Area, Prismoidal, Pappus, Monte Carlo, contour, and computer-aided methods (Easa 1992b, 2003, Bayoğlu 1997, Seçkin 2003, Eliou et al. 2019), the Average End Area and Prismoidal methods remain the most prevalent and widely applied approaches (Kim and Schonfeld 2001, Wanasinghe et al. 2019).
2.2.1 Traditional Earthwork Estimation Methods
2.2.1.1 Average End Area Method
In the design of forest roads, the Average End Area Method is used specifically for the estimation of earthwork volumes in tangent sections (straight segments). Recognized as the standard approach for linear infrastructure projects, this method serves as a frequent baseline in earthwork estimations, comparative analyses, and methodological developments (Aruga et al. 2005, Hintz and Vonderohe 2011, Contreras et al. 2012, Cheng and Jiang 2013, Pazhouhan et al. 2017, Eliou et al. 2019). The method relies on the assumption that the volume between two consecutive cross-sections approximates a prism (Bayoğlu 1997). Consequently, the volume is calculated by multiplying the arithmetic mean of the end cross-sectional areas by the horizontal distance between the sections (Eq. 1) (Easa 1992b, 2003, Coulter et al. 2002, Aruga et al. 2005).

This method, which yields more accurate results in flat terrain compared to mountainous areas (Cheng and Jiang 2013) and is widely used (Kim and Schonfeld 2001), tends to overestimate the volume and produces approximate results for curved alignments or non-linear profiles (Oloufa 1991, Easa 1992c). The sensitivity of the method is directly proportional to the density of cross-section spacing (Seçkin 2003); indeed, in case the critical threshold value is exceeded, specified as 30 m by Cheng and Jiang (2013) and 25–50 m in tangent sections by Bayoğlu (1997), the risk of failing to reflect terrain variations arises. The cross-sections constituting the basis for the estimation are classified as cut-only, fill-only, or mixed profiles (Kavanagh 2010), depending on the elevation difference between the natural ground and the design grade line (Artun et al. 2020).
2.2.1.2 Prismoidal Method
The Prismoidal Method, which applies Simpson's rule under the assumption that the terrain longitudinal profile between cross-sections is linear (Easa 1992b, 2003, Coulter et al. 2002, Aruga et al. 2005), yields higher accuracy as the cross-section interval decreases (Kim and Schonfeld 2001). This method bases the volume (V) estimation on two consecutive cross-sectional areas (A1 and A2) and a middle cross-sectional area (Aₘ). Crucially, Aₘ is not the arithmetic mean of the end areas; rather, it is derived from the mean of the linear dimensions (widths and heights) of the end sections (Easa 1988b, Kavanagh 2010), as shown in Eq. 2:

This method necessitates the determination of intersection points particularly within cut-fill transitions based on the assumption that the terrain profile maintains a constant slope (Easa 1988b). Consequently, in contrast to the established tendency of the Average End Area method to overestimate volumes (Oloufa 1991, Easa 1992b, 2003, Coulter et al. 2002, Aruga et al. 2005), the Prismoidal Method yields significantly higher accuracy and precision in linear profiles (Kavanagh 2010).
2.2.1.3 Simplified Applicable Lengths Method
The Simplified Applicable Lengths Method was developed by Eliou et al. (2019) as a refinement of the classical applicable lengths approach to accelerate the estimation process by reducing computational effort. This method is based on the principle that the applicable lengths are consistently equal to the average value of the preceding and succeeding distances, regardless of the cross-section types before or after them (Eq. 3):

2.2.1.4 Pappus-Based Method
The Pappus-based method is used for earthwork estimations in horizontal curves (Easa 2003), based on the principle that the volume of a solid generated by rotating a plane figure about an axis is equal to the product of the figure's area and the path length traced by its centroid (Easa 1992b, 2003, Aruga et al. 2005). For curved sections of forest roads, this method estimates the volume by averaging the rotational volumes of the cross-sections (Easa 1992b, 2003, Aruga et al. 2005, Aruga 2005).
A critical parameter in this estimation is eccentricity (e), which is determined by the elevation differences between the natural ground and the road, as well as their distances to the road centerline (Aruga et al. 2005). Eccentricity values take a positive sign when directed outward from the curve centerline and a negative sign when directed inward (Easa 1992b, 2003, Aruga et al. 2005). Volume estimation is performed using the following equations (Eqs. 4, 5, and 6) (Easa 1992b, 2003, Aruga et al. 2005):
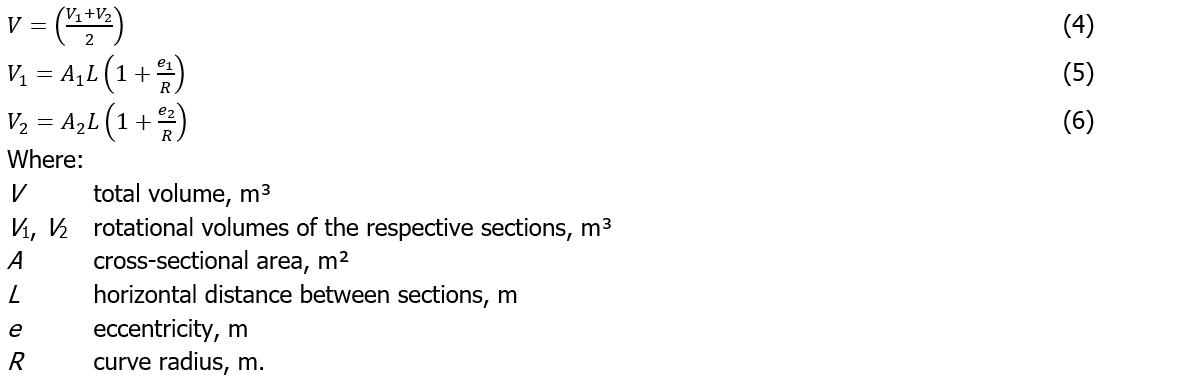
While this method yields precise results when the geometric characteristics of two consecutive sections are identical or in flat terrain with low variations, estimated values often deviate from the true volume in hilly, mountainous, and non-linear undulating terrain profiles (Easa 1992b, Aruga et al. 2005). Furthermore, the method is considered valid only in cases where the consecutive sections are of the same type either entirely cut or entirely fill (Contreras et al. 2012).
In this study, the Pappus-based method was applied exclusively to cross-sections located on horizontal curves. For mixed (cut-fill) cross-sections on curves, the cut and fill components were treated separately: the centroids of the cut and fill areas were determined independently by measuring their distances to the road axis in the two-dimensional cross-section drawings, the eccentricity values of the cut and fill areas were calculated separately, and the respective cut and fill volumes were computed using the Pappus formula.
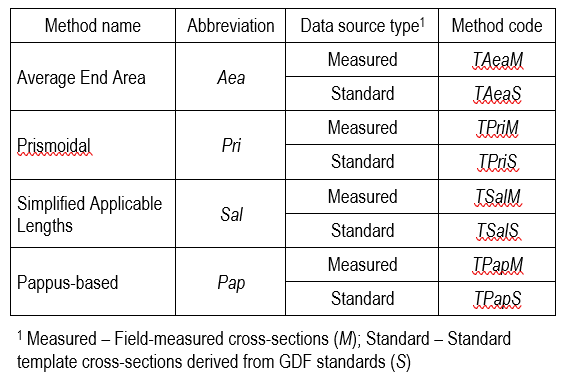
These four traditional methods were used to estimate cut and fill volumes for forest road No. 001, evaluated in its existing state. Given that the study site consists of an already constructed road, volume estimations for each method were performed under two distinct scenarios: using cross-section data directly measured (M) from the field, and using standard template (S) cross-section data. Consequently, a total of eight calculation variations were obtained. The methods employed in the analyses were defined by a systematic coding structure where the first character represents the traditional method (T), the middle characters indicate the method abbreviation (Aea/Pri/Sal/Pap), and the final character denotes the data source used (M/S) (Table 1).
Within the scope of the research, a standard template cross-section was created with geometric parameters determined in accordance with the standards specified in the GDF (2008) communiqué. These parameters include a cut slope of 1:1, a fill slope of 2:3, a ditch slope of 1:3, a ditch width of 1.0 m, a shoulder width of 0.5 m, a platform width of 4.0 m, and a cross slope of 2%.
Table 1 Nomenclature for traditional earthwork estimation methods
2.2.2 Computer-Aided (3D) Earthwork Estimations
Earthwork estimation processes have evolved from traditional cross-section and grid methods to modern digital model-based approaches (Wen et al. 2021), gaining widespread application due to the speed and systematic evaluation capabilities of computer-aided analysis (Coulter et al. 2002). Within this framework, Digital Terrain Models (DTM) (Bayoğlu 1997, Akay 2004) composed of spatial coordinates (X, Y, Z) representing the ground surface are generated using mathematical rules that describe the terrain via a finite set of points, typically as Triangulated Irregular Networks (TIN) or Grid Networks (GN) (Wen et al. 2021). Specifically for estimating cut-fill volumes between the natural ground and the design surface (Cheng and Jiang 2013), the total volume of the prisms forming the TIN mesh serves as the basis (Wen et al. 2021). Furthermore, the eccentricity factor is incorporated for curved alignments (Aruga et al. 2005).
Since the accuracy of road design parameters is directly dependent on the resolution of the digital model used (Aruga 2005, Akgül et al. 2018), data acquisition techniques such as photogrammetry, Light Detection and Ranging (LiDAR), Unmanned Aerial Vehicles (UAV), and terrestrial methods (RTK-GNSS and Terrestrial Laser Scanning [TLS]) (Nelson et al. 2009, Gülci et al. 2021) are evaluated within a cost-effectiveness framework. This evaluation considers the minimum density requirement of 25 points/ha mandated by regulations in Türkiye (Official Gazette 2005).
While LiDAR data provides high accuracy, it is associated with high costs and labor intensity (Reutebuch et al. 2003, Aruga et al. 2005). Similarly, UAV systems offer high efficiency and speed (Siebert and Teizer 2014, Akgül et al. 2018) but necessitate high-performance workstations due to large data sizes. In recent years, RTK/PPK UAV-based surveys have emerged as a promising alternative for earthwork volume estimation in forest road planning, combining the spatial coverage and processing speed of UAV systems with the positioning accuracy of RTK/PPK corrections, thereby offering a cost-effective and time-efficient solution compared to conventional terrestrial surveys (Siebert and Teizer 2014, Akgül et al. 2018). Conversely, although RTK-GNSS systems appear disadvantageous regarding personnel and time efficiency for instance, a task requiring 35 minutes with 2 personnel via UAV may take 24 days with 7 personnel using GNSS (Akgül et al. 2018), they gain prominence in forestry operations (Gülci et al. 2021). This preference arises because GNSS systems do not require the establishment of ground control points, offer simplified setup and data management (Siebert and Teizer 2014), and provide high-precision ground data with temporal flexibility.
In the processing of the obtained data, GIS-based analyses (Tunay et al. 2001) and the BIM-based solution Autodesk Civil 3D (Cheng and Jiang 2013) were used in an integrated manner. Specifically for this study, the forest road design process within Civil 3D followed a sequential workflow: terrain modeling, horizontal alignment and curve design, longitudinal profile (grade line) construction, corridor modeling, earthwork (volume) estimation, and cross-section drafting.
To enhance precision during the modeling stage, point data acquired from the field via terrestrial methods (RTK-GNSS and Total Station) were not directly converted into a Civil 3D TIN model. Instead, they were first processed on a grid basis using the ArcGIS »Topo to Raster« function and converted into contour lines via the »Contour« tool. Subsequently, these contours were imported into the Civil 3D environment to generate the surface. Finally, design and earthwork operations were executed along a »2D Polyline« alignment superimposed on the existing road route. The »Topo to Raster« function was selected due to its use of the ANUDEM algorithm, which automatically removes spurious depressions (sinks) a critical feature in mountainous forest road terrain (Akgül et al. 2018). To assess surface quality, a parallel surface was also generated directly from the original point data using the TIN-based method in Civil 3D, and both surfaces were evaluated before the contour-based surface was selected.
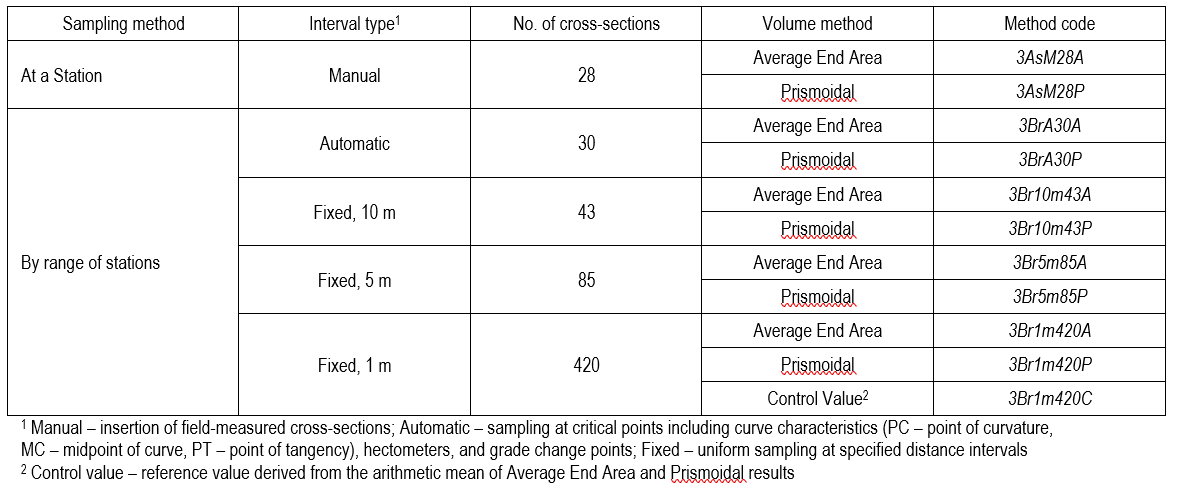
The eleven different volume estimation variations performed within the scope of the research through Civil 3D software integration were analyzed within the framework of a hierarchical coding system (Table 2). In this system, the first character represents the three-dimensional method (3), and the subsequent characters sequentially define the sample line creation function (As: At a station / Br: By range of stations), interval definitions (M: Manual, A: Automatic, 10m/5m/1m: Fixed), the number of cross-sections (28/30/43/85/420), and the volume estimation algorithms (A: Average End Area / P: Prismoidal).
In line with this systematic approach, the study evaluated models with manually defined stations (3AsM28A/P); automatic stations determined by critical points in the horizontal and vertical geometry of the alignment, such as curve characteristics, slope changes, and hectometers (3BrA30A/P); and fixed-interval models at different degrees of precision (3Br10m43A/P, 3Br5m85A/P, 3Br1m420A/P). Furthermore, since AutoCAD Civil 3D provides both Average End Area and Prismoidal algorithms as volume estimation options (Artun et al. 2020), both were applied at the 1 m interval and their results were reported separately (3Br1m420A and 3Br1m420P). Their arithmetic mean (3Br1m420C) was used as a single reference point to facilitate comparison with the other methods, in accordance with the approach suggested by Contreras et al. (2012), as 1 m interval cross-sections yield results closest to the true volume (Kim and Schonfeld 2001, Aruga et al. 2005, Hintz and Vonderohe 2011).
Table 2 Nomenclature and experimental design parameters for Civil 3D earthwork estimations
3. Results
3.1 Characteristics of Natural Ground and Geometric Design
Road cross-sections were derived by performing measurements at 28 stations over a 420 meter section of forest road No. 001. This road, located within the northern parcel of the Istanbul University-Cerrahpaşa Faculty of Forestry Research and Application Forest, has a total length of 1335 m and is classified as a »Normal Type B« forest road according to Communiqué No. 292 (GDF 2008).
3.1.1 Terrain and Cross-Section Characteristics
Detailed measurements of terrain morphology and road geometry revealed that sideslopes in the study area varied widely between 6.00% and 53.00% (Mean: 31.39%). Natural ground elevations ranged from 217.516 m to 241.786 m, averaging 231.929 m. Regarding the road platform, widths ranged between 3.17 m and 5.92 m (Mean: 4.01 m), while platform elevations varied between 218.348 m and 241.654 m (Mean: 231.863 m).
Analysis of the cross-section typology for the 28 stations revealed that the mixed cross-section was the predominant type (21 stations), followed by full cut (6) and full fill (1) profiles. Regarding spatial distribution, the mixed cross-section structure persisted for the first four stations, transitioning to a full fill profile at st. 5. While mixed cross-sections resumed from st. 6 to st. 22, the final section (st. 23 to the endpoint) consisted of six full cut cross-sections.
Based on the cross-section dimensions specified in Communiqué No. 292 (GDF 2008), geometric and volumetric parameters for cut and fill operations were detailed. Regarding cut data, cut height ranged from a Min. of 0.04 m (st. 1) to a Max. of 4.22 m (st. 24), averaging 1.63 m (Total: 45.50 m). Cut width varied between 0.60 m (st. 7) and 8.85 m (st. 27) (Mean: 3.63 m; Total: 101.67 m), while cut area ranged from 0.10 m² (st. 4) to 12.12 m² (st. 24) (Mean: 3.70 m²; Total: 103.68 m²). Cut slope distance was measured as Max. 12.11 m (st. 27) and Min. 1.34 m (St. 7) (Mean: 5.58 m; Total: 156.22 m); similarly, cut slope length ranged from 0.97 m (st. 7) to 6.13 m (st. 27) (Mean: 2.76 m; Total: 77.36 m). In fill operations, fill width was calculated between 0.12 m (st. 16/17) and 7.21 m (st. 5) (Mean: 2.82 m; Total: 78.97 m), while fill area ranged from 0.12 m² (st. 17) to 14.25 m² (st. 8) (Mean: 3.60 m²; Total: 100.92 m²).
3.1.2 Horizontal and Vertical Alignment Results
Analysis of the longitudinal gradient characteristics revealed an average descending grade of 5.57% throughout the alignment. However, standard limits were exceeded in specific intervals. Notably, the gradient values between st. 15 – st. 16 (15.34%) and st. 17 – st. 18 (14.64%) surpassed the limits prescribed for Normal Type B forest roads. Additionally, reverse grades were identified between stations st. 3 – st. 4, st. 4 – st. 5, st. 20 – st. 21, and st. 22 – st. 23.
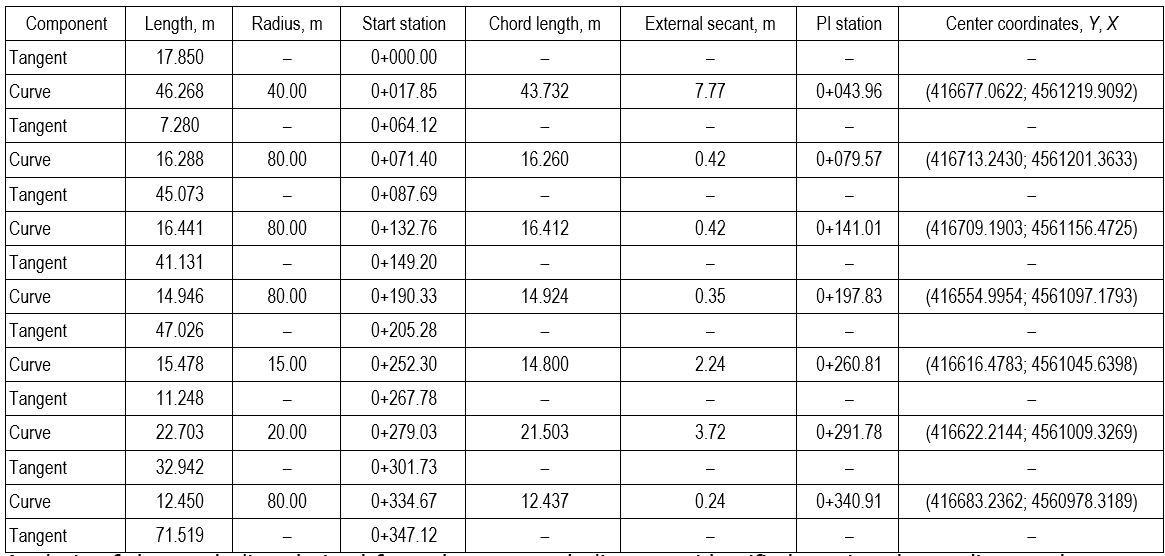
Analysis performed via the »Alignment Grid View« module in Civil 3D identified a total of seven horizontal curves on road alignment No. 001, with radii ranging from 15 m to 80 m. Examination of the geometric characteristics revealed that chord lengths varied between 12.44 m (at 0+340.91) and 43.73 m (at 0+017.85), with an average of 20.01 m. Regarding curve (arc) lengths, values ranged from a Min. of 12.45 m (0+334.67) to a Max. of 46.26 m (0+017.85), averaging 20.65 m. Additionally, external secant (bisector) distances were observed to range between 0.24 m and 7.77 m (Mean: 2.17 m).
Examination of the route distribution regarding alignment components revealed that 144.57 m of the road consists of curves, while 274.07 m comprises straight sections (tangents). When the geometry of these straight sections was evaluated, lengths were determined to vary between 7.28 m (at 0+064.12) and 71.52 m (at 0+347.12), with an average length of 34.26 m (Table 3).
Table 3 Geometric parameters of the horizontal alignment components
Analysis of the grade line derived from the surveyed alignment identified varying descending grades across specific intervals: 0.95% (0–100 m), 6.03% (0+100–0+200 m), 7.42% (0+200–0+240 m), 10.15% (0+240–0+270 m), 2.09% (0+270–0+300 m), 6.52% (0+300–0+340 m), 7.91% (0+340–0+400 m), and 12.50% (0+400–0+419 m). The average descending grade throughout the alignment was calculated as 5.57% (Min: 0.95%; Max: 12.50%). However, it was determined that the values particularly in the first 100 m and the final 18.64 m sections did not comply with the limits specified in Communiqué No. 292 (GDF 2008).
To ensure comparability with traditional methods, different cross-section generation scenarios were analyzed using the »At a Station« and »By range of stations« functions in Autodesk Civil 3D. In the manual definition process (»At a Station«), 28 cross-sections corresponding to field stake points were generated. These were spaced at 20 m intervals on tangents and 5–15 m on curves depending on the radius, based on a 10 m width (right/left) considered sufficient for forest roads. Conversely, in the automatic definition process (»By range of stations«), 30 cross-sections were generated based on critical geometric points (start, end, grade change, PC, MC, PT, hectometers). Additionally, 43 and 85 cross-sections were produced when constant intervals of 10 m and 5 m were applied, respectively (Table 4).
In the final stage of modeling, a road corridor was generated using a standard template cross-section compliant with GDF (2008) standards. Key parameters included a cut slope of 1:1, fill slope of 2:3, ditch dimensions of 1:3/1.0 m, a 0.5 m shoulder, a 4.0 m platform, and a 2% cross slope. Since the study was conducted on natural ground (an existing road surface), a »Top« surface definition was implemented in the model to serve as the basis for volume calculations, rather than applying material thickness criteria.
Table 4 Interval distances and elevation characteristics of the methods

3.2 Earthwork Estimations by Traditional Methods
For the purpose of determining earthwork volumes on forest road No. 001, estimations were performed using four primary methods: Average End Area, Prismoidal, Simplified Applicable Lengths, and Pappus-based approaches. A total of eight variations were analyzed based on both field-measured cross-section data (M) and standard template cross-sections (S) designed in accordance with GDF (2008) standards (Table 5).
Table 5 Earthwork volumes estimated by traditional methods (number of sections: 28)
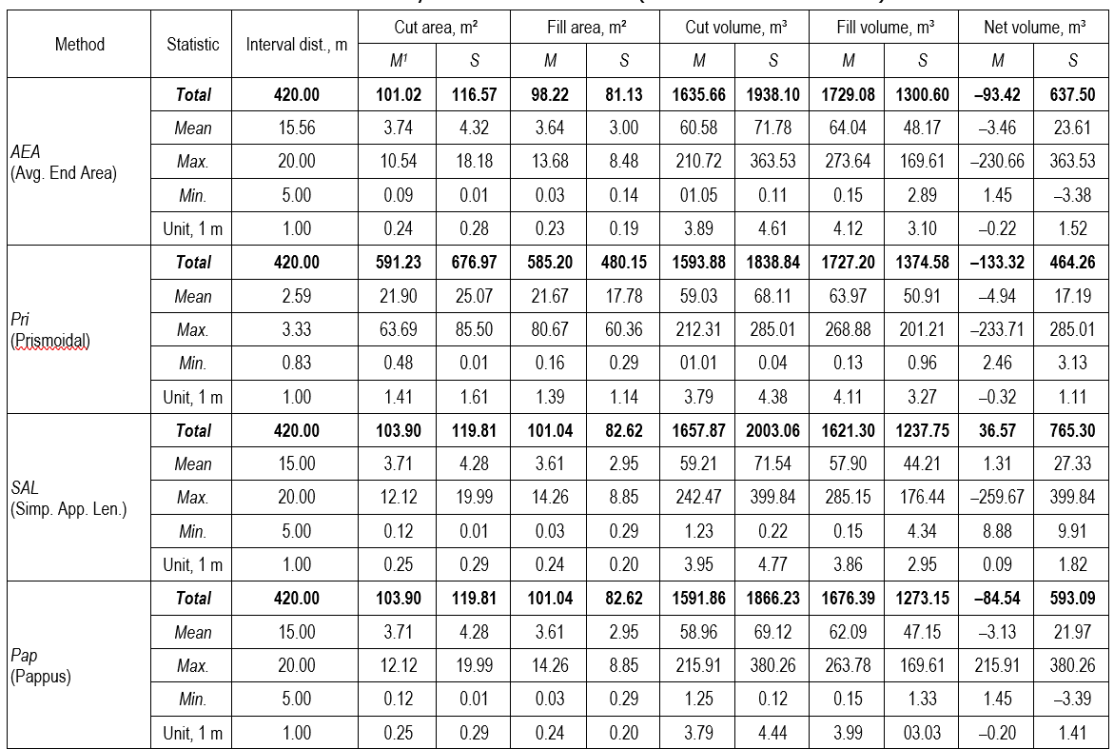
While the Average End Area (Eq. 1) and Simplified Applicable Lengths (Eq. 3) methods were applied directly, Prismoidal Method estimations incorporated generated mid-sections (Am) via Eq. 2. In the Pappus-based analyses, stations located on tangents (st. 1, st. 13, st. 17, st. 18, st. 26, st. 27, st. 28) were excluded as the method applies to curvature. Consequently, volumes were estimated using Eqs. 4, 5 and 6, relying on eccentricity values (cut: ek, fill: ef) determined via section centroids (cut: Ck, fill: Cf). In these curved sections, where the average radius was 54 m (Min.: 15 m, Max.: 80 m), eccentricity values averaged 2.94 m (Min.: 0.45 m, Max.: 6.84 m).
Results from the eight estimation variations indicated a distinct contrast between data sources. While field-measured cross-section data (M) yielded predominantly negative (fill deficit) or low net volumes (e.g., TAeaM: –93.42 m³; TPriM: –133.32 m³; TPapM: –84.54 m³; TSalM: 36.57 m³), standard template cross-section (S) applications consistently exhibited significant positive values (cut surplus) across all methods. Specifically, TAeaS (637.50 m³), TPriS (464.26 m³), and TPapS (593.09 m³) demonstrated this trend, with TSalS presenting the highest net volume in the series (Table 5).
3.3 Computer-Aided (3D) Earthwork Estimations
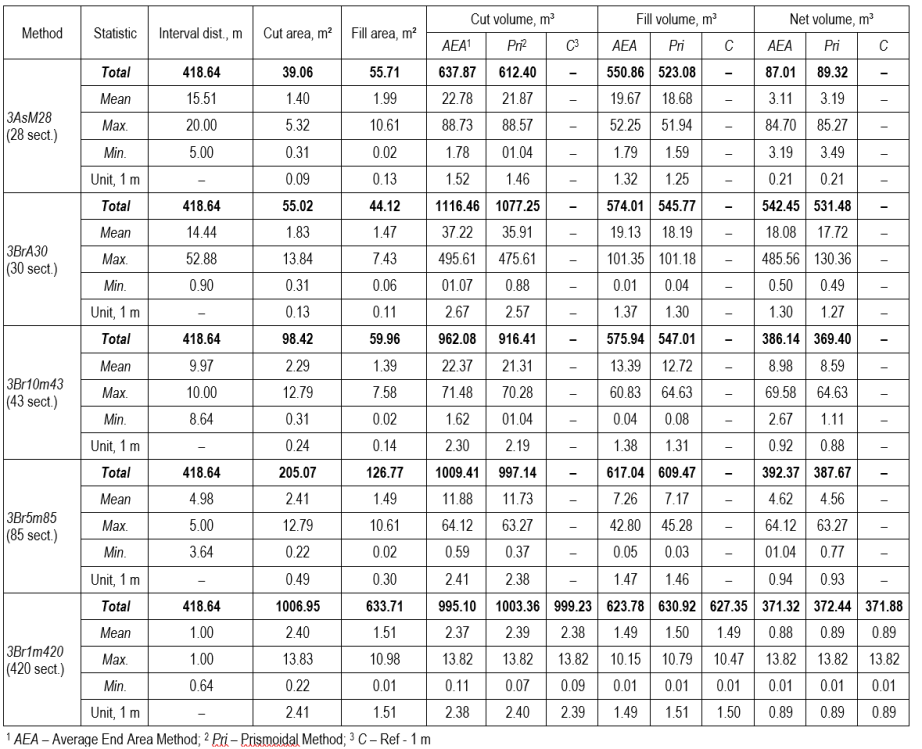
The volumetric results corresponding to the methodological variations and experimental design parameters detailed in Table 2 are presented in Table 6, grouped by the number of generated cross-sections. In all evaluated scenarios, the fundamental geometric parameters, specifically the number of cross-sections, interval distances, and cut/fill areas, were kept constant. However, the resulting cut, fill, and net volume quantities differed based on the volume estimation algorithms applied and were therefore reported separately for both the Average End Area and Prismoidal methods.
3.3.1 Variations in Manual and Automatic Cross-Section Generation
In the manual definition scenario, 28 cross-sections were generated based on field measurement points using the »At a Station« function. Earthwork volumes for this model were estimated using the Average End Area (3AsM28A) and Prismoidal (3AsM28P) methods. In contrast, the automatic definition scenario used the »By range of stations« function to generate a 30-cross-section model by targeting critical geometric points, specifically curve key points (PC, MC, PT), hectometers, and vertical geometry change points. This approach was evaluated under the method codes 3BrA30A and 3BrA30P. The resulting volumetric estimations for these coarse-resolution scenarios are provided in Table 6.
3.3.2 Analysis of Constant Interval Cross-Section Groups
In scenarios where cross-section intervals were fixed, earthwork volumes were estimated using the 3Br10m43A and 3Br10m43P methods within the 43-cross-section model generated at 10 m intervals. Similarly, for the 85-cross-section model created at 5 m intervals, estimations were performed using the 3Br5m85A and 3Br5m85P methods. The volumetric outputs regarding these fixed-interval strategies are presented in Table 6.
Finally, the 3Br1m420A and 3Br1m420P methods were employed in the 420 cross-section model generated at constant 1 m intervals, representing the highest precision modeling approach. Additionally, the 3Br1m420C (control) method, derived by averaging the results of these two methods, is presented alongside the other 1 m interval analyses in Table 6.
Table 6 Earthwork volumes estimated using Computer-Aided (Civil 3D) methods
3.4 Statistical Comparison of Earthwork Estimation Methods
Statistical analyses were performed using SPSS software to evaluate the validity of earthwork volumes obtained through traditional and computer-aided methods and their relationship with the Control Method. The analysis process involved examining the normality of data distribution, the homogeneity of variances, and the statistical significance of the differences observed between groups. Calculations in net earthwork volume estimations obtained from traditional methods and computer-aided estimation methods were performed in cubic meters (m³). Statistical calculations were performed in cubic meters.
3.4.1 Statistical Analysis of Traditional Methods
The conformity of net earthwork volume estimates derived from traditional methods to a normal distribution was assessed using the Kolmogorov-Smirnov and Shapiro-Wilk tests. The analysis indicated that the datasets corresponding to the TAeaS, TSalS, and TPapS methods did not exhibit a normal distribution (p<0.05). To satisfy the assumption of normality, a logarithmic (ln) transformation was applied to these series. Following the transformation, a one-way analysis of variance (ANOVA) revealed a statistically significant difference among the traditional methods (F=18.468; p<0.001) (Table 7).
Table 7 ANOVA test results comparing net earthwork volumes estimated by traditional methods

In the analysis of the relationship between traditional methods and the computer-aided estimated Control Method (3Br1m420C), the homogeneity of variances was first assessed using Levene’s test. The results indicated that the variances were not homogeneous (p<0.001). Consequently, the ANOVA test revealed a statistically significant difference between the groups (F=103.300; p<0.001) (Table 8).
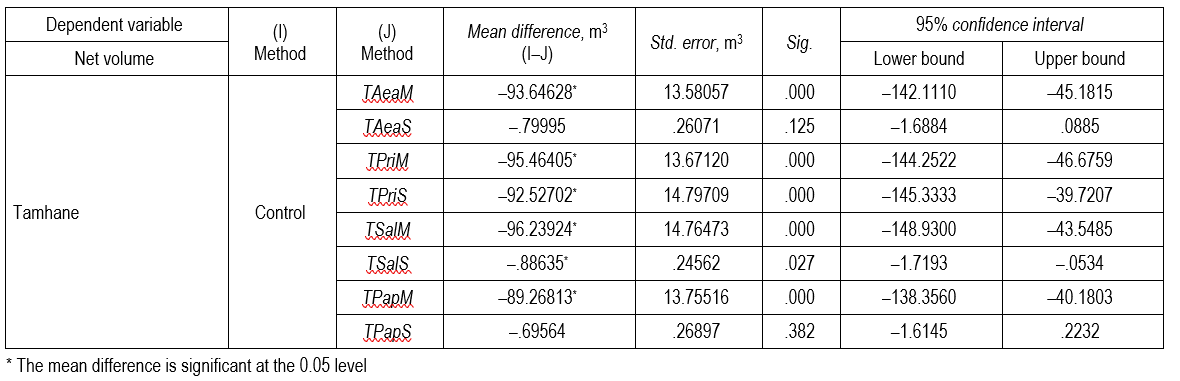
Given the non-homogeneity of variances, Tamhane’s T2 post-hoc test was applied to identify the specific sources of divergence. The results demonstrated no statistically significant difference between the Control Method and the Average End Area (TAeaS) (p=0.125) or Pappus (TPapS) (p=0.382) methods derived from standard template cross-section data. Conversely, all other traditional methods differed significantly (p<0.05) from the Control Method (Table 9).
Table 8 ANOVA results comparing traditional methods and the control method based on net earthwork volumes

Table 9 Tamhane’s T2 multiple comparison test results between traditional methods and the Control Method
3.4.2 Statistical Analysis of Computer-Aided Methods
In the analysis of computer-aided methods, to satisfy the assumption of normality, a square root transformation was applied to the 3AsM28A, 3AsM28P, 3Br10m43A, 3Br10m43P, 3Br5m85A, and 3Br5m85P datasets. Conversely, a natural logarithmic (ln) transformation was applied to the 3BrA30A and 3BrA30P methods. Following these transformations, the homogeneity of variances was assessed and determined to be non-homogeneous (p<0.001). Consequently, the ANOVA test revealed statistically significant differences among the groups (F=7.361; p<0.001) (Table 10).
Table 10 ANOVA results comparing net earthwork volumes estimated by computer-aided methods

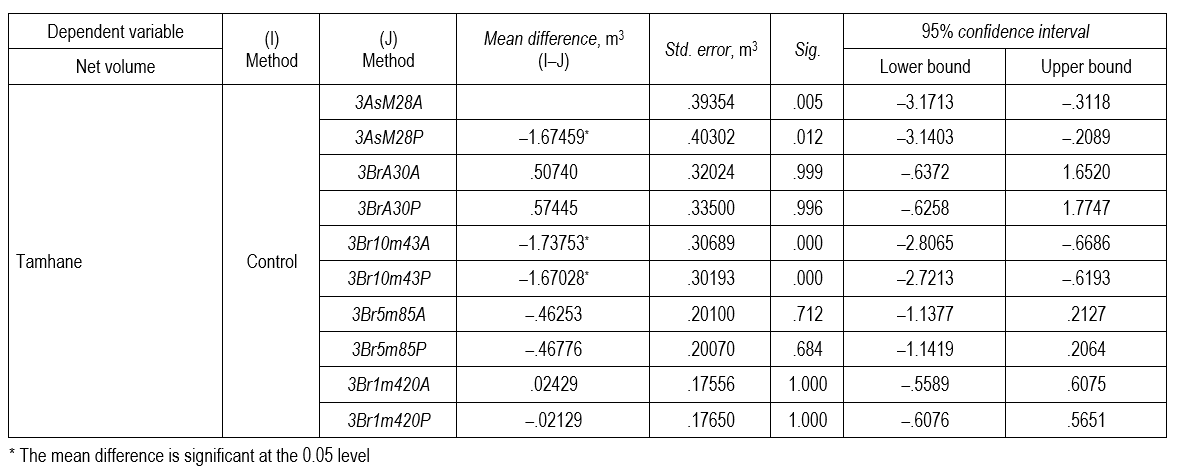
To identify the specific sources of variance, Tamhane’s T2 multiple comparison test was applied. The analysis revealed no statistically significant difference between the Control Method and the 3BrA30A (p=0.999), 3BrA30P (p=0.996), 3Br5m85A (p=0.712), 3Br5m85P (p=0.684), 3Br1m420A (p=1.000), and 3Br1m420P (p=1.000) methods. The results indicate that the computer-aided methods generated using the »By range of stations« function specifically those incorporating curve key points, hectometers, and vertical geometry, as well as the 5 m constant interval strategy produced results statistically equivalent to the Control Method. In contrast, the manual identification method (»At a station«) and the 10 m constant interval strategy (3AsM28 and 3Br10m43 series) differed significantly (p<0.05) from the Control Method (Table 11).
Table 11 Tamhane’s T2 multiple comparison test results between computer-aided methods and the Control Method
4. Discussion
In this study, various earthwork estimation methods were evaluated and compared to analyze their accuracy and applicability in forest road projects. To achieve this, earthwork volumes for the sampled road (No. 001) were estimated using both traditional manual methods and computer-aided design (CAD) via Autodesk Civil 3D. A preliminary geometric comparison revealed a minor discrepancy in the total road length: while field measurements recorded a length of 420.00 m, the computer-aided alignment resulted in 418.64 m. This difference of approximately 0.32% is negligible and is attributed to cumulative measurement errors during field surveys or the inherent precision limits of the surveying instruments used.
Within the scope of the study, a total of eight distinct volume values were initially estimated using traditional methods, comprising four based on field-measured cross-sections and four based on standard template cross-sections. Subsequently, ten different 3D earthwork volume estimations were performed using computer-aided methods. These included scenarios based on fixed field stations (2), automatic generation considering curve key points (PC, MC, PT), hectometers, and vertical geometry (2), as well as constant sampling intervals of 10 m, 5 m, and 1 m (two methods each, totaling 6). Finally, a high-precision Control Method was established by averaging the volume values obtained from the »Average End Area« and »Prismoidal« methods at 1 m intervals in Civil 3D. The comprehensive earthwork volume results for all 19 evaluated methods are presented in Table 12.
The results of this study demonstrate that road geometric standards, terrain surface variations, and cross-section intervals directly influence earthwork estimations and volume discrepancies among methods. According to the statistical analyses (ANOVA and Tamhane’s T2), the traditional methods TAeaS and TPapS, as well as the computer-aided methods 3BrA30A/P and 3Br5m85A/P, were found to be statistically indistinguishable from the Control Method (p>0.05). Regarding traditional methods, the positioning of station points is of critical importance, as cross-sectional areas are intrinsically linked to the interval distance. The risk of deviation arising from the assumption of constant longitudinal and transverse slopes is consistent with the findings of Easa (1988a), who reported that methods assuming a linear ground profile tend to underestimate volume by approximately 7%.
The Average End Area method remains the most widely adopted approach in earthwork estimation (Aruga et al. 2005, Hintz and Vonderohe 2011, Contreras et al. 2012, Cheng and Jiang 2013, Pazhouhan et al. 2017, Eliou et al. 2019). Although this method, which conceptually treats the volume between two cross-sections as a prism (Bayoğlu 1997), yields reliable results on flat terrain (Aruga et al. 2005, Slattery et al. 2012, Cheng and Jiang 2013), it produces only approximate values in curved sections (Easa 1992b). Consequently, the method tends to overestimate volumes, with reported deviations reaching 5.79% (Oloufa 1991), 26% (Easa 1992b), and up to 39% (Epps and Corey 1990) compared to modified methods found in the literature. Corroborating these findings, the current study determined that this method estimated higher cut-and-fill quantities than alternative approaches, a result attributed to the uneven terrain structure, abrupt slope changes, and horizontal geometry factors (Contreras et al. 2012, Şentürk et al. 2018).
Although the Prismoidal Method necessitates a time-consuming process due to the requirement for additional mid-section calculations, it is widely recognized for yielding more accurate results than the Average End Area method (Contreras et al. 2012). It provides superior precision, particularly in linear profiles (Oloufa 1991, Easa 1992b, 2003, Coulter et al. 2002). Consistent with the literature (Aruga et al. 2005), this method yielded the results closest to the Control Method among all traditional techniques evaluated in this study. This result aligns with Oloufa's (1991) prediction that the 0.87% difference detected in a single cross-section example would amplify with the distance multiplier. However, despite its relative superior performance, significant deviations were observed; specifically, cut and fill volumes were approximately twice as high as those of the Control Method. These discrepancies are attributed to the complex horizontal alignment geometry, sudden slope changes in the terrain, and potential errors inherent in the manual generation of mid-sections.
Table 12 Summary of earthwork volume estimations derived from traditional and computer-aided methods
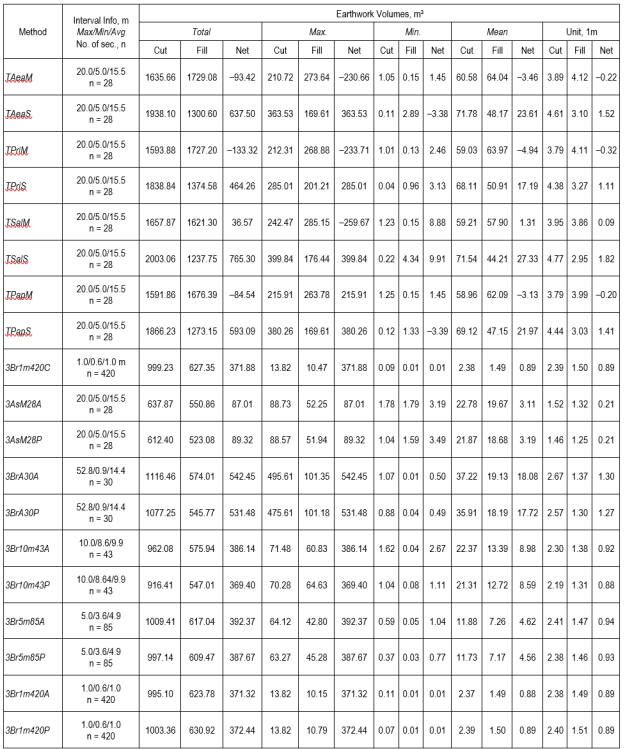
Regarding the Pappus-based method, which is stated in the literature to perform more accurate earthwork estimation compared to the Average End Area method (Aruga et al. 2005), the results of this study indicated a distinct closeness to the Control Method, confirmed statistically (p>0.05) particularly when standard template cross-section data were used. Furthermore, this method produced the highest cut volumes, a characteristic attributable to its principle of accounting for the volumetric effects resulting from the rotation of cross-sections in curves. Conversely, the method deviated from the Control Method in calculations derived from measured cross-section data. This result was evaluated to stem from the variations in cross-sectional areas (Measured vs. Standard Template), a phenomenon consistent with the simulation comparisons reported by Easa (2003).
In an effort to minimize calculation effort and time, the »Simplified Applicable Lengths Method« was streamlined by Eliou et al. (2019) to rely on distance averages without verifying the types of preceding and succeeding cross-sections. In this study, this method yielded the highest volume estimations among all traditional methods evaluated (Table 12). This substantial increase, manifesting entirely as a cut surplus, was particularly pronounced when standard template cross-section data were used.
In the analyses performed using traditional methods, distinct discrepancies arising from variations in cut and fill areas were observed between measured (M) and standard template (S) cross-section data, despite the maintenance of constant interval distances. Specifically, with the use of standard template cross-section data, the net volume in the Average End Area method increased by 7.8 times, driven by an 18.5% increase in cut volume and a 24.8% decrease in fill volume. Similarly, in the Prismoidal method, the net volume increased by 4.5 times, corresponding to a 15.4% rise in cut volume and a 20.4% reduction in fill volume. In the Pappus theorem, the net volume transformed from a »fill deficit« to a »cut surplus« exhibiting an 8.0-fold increase as the cut volume rose by 17.2% and the fill volume declined by 24.8%. The Simplified Applicable Lengths method showed the most dramatic deviation, with a 19.9-fold increase in net volume. Notably, in the Pappus-based method, a decrease in volume was observed despite an 18.6% increase in the fill area; this anomaly was attributed to the eccentricity parameter inherent to the method (Table 12). These results align with Kim and Schonfeld’s (2001) emphasis on the critical role of area calculation precision and highlight the substantial deviations caused by non-standard construction practices. Indeed, this discrepancy between planning and implementation parallels the findings of Gümüş et al. (2015), who reported a 31% quantity difference, and Acar and Karabacak (2012), who noted a 4.88% cost increase.
Deviation of a constructed forest road from the planned standard template cross-section (platform width, slope ratio, etc.) is an almost inevitable and frequently observed situation (Gümüş et al. 2015). For example, in a field study by Gümüş et al. (2015), the average road width planned at 5.31 m in the standard template was found to be 6.04 m as-built (a 0.73 m deviation), with a 4.12% deviation in road slope. This results from the following factors: standard template cross-section sheets are generally prepared under the assumption that there is no difference between the road platform elevation and the natural ground elevation (Gümüş et al. 2015); however, since the actual terrain is continuously undulating, operators are forced to perform unplanned cut and fill during road construction (Gümüş et al. 2015). In addition, since forest roads are constructed on steep terrain, manoeuvring difficulties of construction equipment (bulldozers, excavators) or operator discretion may cause the road to be widened beyond what is necessary; on the other hand, on slopes exceeding 75% or in rocky terrain, the road platform width may be mandatorily reduced from 4 m to 3 m in order to prevent excessive excavation and to prevent the excavated material from damaging the forest structure on the lower slope (GDF 2008). Furthermore, soil classes (soil, decomposed rock, hard rock) are generally determined only through observational methods prior to tendering (Acar and Karabacak 2012); encountering unforeseen hard rock strata during construction leads to mandatory field changes in the planned slope ratio, for example, a gentle slope planned for soil being replaced with a steep slope for rock (Acar and Karabacak 2012). Gümüş et al. (2015) measured that the 0.73 m physical deviation in road width and the slope differences resulted in the total cut volume on an approximately 2 km road being 31% (3269.88 m³) higher than estimated. Despite these variations, statistical analyses revealed that the TAeaS and TPapS methods calculated using standard template cross-section data did not yield a significant difference from the Control Method (p>0.05).
The discrepancy between field-measured cross-section results (which produced a fill deficit in all traditional methods) and standard template cross-section results (which consistently produced a cut surplus) has significant consequences for forest road construction. In current practice, earthwork quantities for forest road tenders are typically estimated using standard template cross-sections in accordance with GDF (2008) standards. However, this study demonstrates that standard template cross-sections systematically overestimate cut volumes while underestimating fill volumes compared to field-measured cross-section data. For instance, in the Average End Area method, the net volume increased by a factor of 7.8 when transitioning from field-measured to standard template cross-sections (from –93.42 m³ to +637.50 m³), representing a discrepancy of 730.92 m³ over a 420 m road section. Such discrepancies between tender estimates and as-built quantities can lead to contractual disputes, unjustified financial gains, or incomplete works as documented by Gümüş et al. (2015), who reported a 31% quantity difference, and Acar and Karabacak (2012), who noted a 4.88% cost increase in forest road construction.
The engineering significance of volume differences is further illustrated by Hintz and Vonderohe (2011), who reported that the use of 100 ft (approximately 30 m) cross-section intervals resulted in a 4.54% volume discrepancy, translating into a discrepancy of $112,500 in fill and $95,800 in cut operations in a single project. These findings underline the critical role of cross-section intervals and approach selection in earthwork volume estimation.
Beyond economic implications, the failure to achieve cut-fill balance has direct environmental consequences. As emphasized by Akay et al. (2007), poorly maintained and substandard forest roads represent the primary source of sediment delivery to streams, and improper slope and drainage practices exacerbate erosion risks. Accurate earthwork planning is therefore an imperative not only for cost management but also for mitigating environmental impacts.
From a standpoint of applicability, the computer-aided approach evaluated in this study offers a clear advantage: the 5 m constant interval strategy using the Prismoidal method (3Br5m85P) produced results statistically indistinguishable from the control method (p=0.684), while reducing cut volume error to 0.21% compared to the control. This finding confirms that computer-aided methods with 5 m cross-section intervals represent a reliable approach for forest road earthwork planning, eliminating the need for more resource-intensive 1 m interval cross-section surveys (Melemez et al. 2015, Şentürk et al. 2018).
The discrepancies in earthwork volume estimations derived from the 3D method specifically designed to determine the effects of cross-section intervals and positioning strategies in computer-aided estimation were addressed in three distinct groups: manually added cross-sections (G1), cross-sections generated considering road geometry (G2), and cross-sections generated by varying the interval (G3). While the literature suggests that cross-section intervals should vary according to the topographic structure (Siyam 1987) and generally recommends intervals of 25–30 m (Bayoğlu 1997, Aruga et al. 2005, Slattery et al. 2012, Contreras et al. 2012, Cheng and Jiang 2013) or more frequent sampling (Melemez et al. 2015, Pazhouhan et al. 2017, Akgül et al. 2018, Şentürk et al. 2018), the evaluation of these intervals in this study revealed critical insights. As emphasized by Contreras et al. (2012), simply reducing the sampling distance is insufficient for precise calculation. This was confirmed by the fact that the G2 strategy, which captures geometric change points (curves, slopes) despite having an average interval distance (14.4 m) similar to that of G1 (15.5 m), yielded results significantly closer to the Control Method. In the analyses of constant intervals, it was determined that the »Average End Area« and »Prismoidal« methods exhibited deviations ranging between 3.72% and 12.81% at 10 m intervals. However, reducing the interval to 5 m and utilizing the Prismoidal function decreased the error in cut volume to a mere 0.21%. This result, verified by both Tamhane’s T2 statistical tests and unit length analysis (Akgül et al. 2018), leads to the conclusion that the 5 m constant interval Prismoidal method among computer-aided approaches, and the Prismoidal and Pappus methods among traditional approaches, represent the most precise and reliable techniques.
The 1 m cross-section interval is accepted in the literature as the reference standard that yields results closest to the true earthwork volume, as it captures micro-topographic variations between consecutive cross-sections with the highest precision (Aruga et al. 2005, Contreras et al. 2012). However, collecting field survey data at 1 m intervals using terrestrial measurement methods is extremely time-consuming and resource-intensive (Aruga et al. 2005, Contreras et al. 2012). In computer-aided environments, generating 420 cross-sections at 1 m intervals also substantially increases computational processing load compared to coarser interval strategies. At 10 m cross-section intervals, non-linear terrain variations between consecutive cross-sections are frequently missed, leading to direct accuracy losses in earthwork volume estimation (Contreras et al. 2012). The 5 m constant interval strategy represents an optimal balance between these two extremes, achieving substantial accuracy improvement without the excessive field survey effort or computational burden associated with 1 m interval modeling. Consistent with these findings, Şentürk et al. (2018) reported that reducing cross-section intervals from 10 m to 5 m in a computer-aided forest road design reduced net volume discrepancies from approximately 80 m³ to 40 m³.
5. Conclusions
The accuracy of cut and fill volume estimations for forest roads planned in high-gradient mountainous terrains is of critical importance regarding both cost and environmental impact (Akay 2004, Abdi et al. 2009). The analyses performed in this study revealed a sharp contrast: calculations based on field-measured cross-section data resulted in a »fill deficit«, whereas those based on standard template cross-section data resulted in a »cut surplus«. This finding demonstrates that GDF standards specifically regarding side slopes and cut-fill ratios are not strictly adhered to in current practice, thereby increasing the risk of environmental degradation. In this context, strict compliance with standard template cross-section dimensions during the construction phase is essential to both eliminate inconsistencies in earthwork estimations and minimize environmental damage.
In the comparative analysis of earthwork estimation methods, it was determined that the Average End Area method and the Simplified Applicable Lengths method, which rely primarily on the distance between cross-sections, deviated significantly from control results in mountainous terrains (Oloufa 1991, Eliou et al. 2019). Conversely, the Prismoidal method and the Pappus-based method were identified as the most precise traditional estimation techniques (Aruga et al. 2005), despite the increased computational effort required for additional data inputs such as mid-sections and eccentricity parameters (Easa 1992b, 2003). Notably, the Pappus-based method distinguishes itself as the unique approach that explicitly accounts for the curvature effect, a critical factor in forest roads characterized by frequent curves. While the Average End Area method offers greater practicality compared to the Prismoidal and Pappus-based methods by eliminating the need for extra data, its tendency to overestimate earthwork volume renders it suitable primarily for predominantly linear and flat terrains; consequently, it is liable to exhibit significant deviations in mountainous regions marked by abrupt slope changes and dense curvature.
In the realm of computer-aided analyses, ANOVA and Tamhane’s T2 statistical tests demonstrated that generating an excessive data volume with highly frequent cross-section intervals (e.g., 1 m) is unnecessary. Instead, incorporating critical points characterizing the horizontal and vertical geometry of the road (such as curve key points and slope changes) into the model alongside a 5-meter constant interval via the »By range of stations« function was proven to be statistically indistinguishable from the Control Method and represents the optimum solution.
In conclusion, to eliminate volume inconsistencies, strict adherence to standard template cross-section standards during the forest road construction phase is strongly recommended. Regarding earthwork estimations, the Pappus-based method is advised among traditional methods for its ability to increase precision by accounting for the curvature effect; meanwhile, geometric modeling with a 5 meter constant interval is identified as the optimum solution in computer-aided design applications.
Future studies could focus on a cost-benefit comparison by contrasting the high-precision ground data obtained in this study with RTK/PPK UAV-derived DTMs and airborne LiDAR datasets. While terrestrial survey methods (RTK-GNSS, Total Station) require considerably lower equipment investment than UAV and LiDAR systems (approximately $25,000 versus $65,000) (Akgül et al. 2018) and remain a practical and economical alternative for small-area surveys without the need for flight operations (Akgül et al. 2016), UAV-based photogrammetry can achieve substantially higher point densities than terrestrial methods (Akgül et al. 2018), and airborne LiDAR is regarded as the standard for exact earthwork calculation due to its capacity to penetrate forest canopy using laser pulses and directly measure the ground surface (Contreras et al. 2012). However, the accuracy of all data acquisition methods under forest cover is influenced by canopy density: RTK-GNSS signal reception and Total Station line-of-sight measurements are both impeded by dense vegetation (Matinnia et al. 2018, Gülci et al. 2021), and even LiDAR despite its canopy-penetrating capability exhibits increasing height error as canopy closure rises, with reported mean errors ranging from 0.16 m in clear-cut areas to 0.31 m under dense, unharvested forest canopy (Reutebuch et al. 2003). Conducting field surveys during the leaf-off season, when satellite signal reception, optical line of sight, and canopy penetration are all improved, may therefore enhance the accuracy of all four data acquisition methods (RTK-GNSS, Total Station, UAV, and LiDAR) under forested conditions. A comparative evaluation of these data acquisition approaches in terms of accuracy, field efficiency, cost, and applicability under varying canopy conditions and survey seasons would provide valuable insight for future forest road earthwork estimation studies.
It should be noted that this study is based on a single forest road section located in a specific terrain and construction context. The transferability of the findings to other terrain types, road standards, and construction conditions should be tested in future studies.
Acknowledgments
This work was supported by the Scientific Research Projects Coordination Unit of Istanbul University-Cerrahpaşa under Project No. 32229. This article is derived from the master's thesis completed by the first author at the Institute of Graduate Studies, Istanbul University-Cerrahpasa.
Conflicts of Interest
The authors declare no conflict of interest. The funders had no role in the design of the study; in the collection, analyses, or interpretation of data; in the writing of the manuscript, or in the decision to publish the results.
6. References
Abdi, E., Majnounian, B., Darvishsefat, A., Mashayekhi, Z., Sessions, J., 2009: A GIS-MCE based model for forest road planning. J. For. Sci. 55(4): 171–176. https://doi.org/10.17221/52/2008-JFS
Acar, H.H., Karabacak, M., 2012: The investigation of approximate cost and progress payment for forest road building in Lakes Region of Turkey. Turk. J. For. 13(1): 21–27. https://doi.org/10.18182/tjf.21878
Akay, A.E., 2004: A new method of designing forest roads. Turk. J. Agric. For. 28(4): 273–279.
Akay, A.E., Erdaş, O., Yüksel, A., Bozali, N., Gündogan, R., Öztürk, T., 2007: Bilgisayar destekli orman yolu planlama modeli. TMMOB Harita ve Kadastro Mühendisleri Odası Ulusal Cografi Bilgi Sistemleri Kongresi, 30. Chamber of Survey and Cadastre Engineers, Trabzon.
Akburak, S., 2013: Meşe ve Gürgen Meşcerelerinde Aralamanın Toprak Solunumu ve Mikrobiyal Solunum Üzerine Etkileri [The Effects of Thinning on Soil Respiration and Microbial Respiration in Oak and Hornbeam Stands]. PhD. Thesis, Istanbul University, Istanbul.
Akgül, M., 2012: Üretim Ormanlarında Tampon Zon Belirleme Kriterleri [Determination of Buffer Zone Criterias for Production Forest]. PhD. Thesis, Istanbul University, Istanbul.
Akgül, M., Demi̇r, M., Öztürk, T., Topatan, H., Budak, Y.E., 2016: Investigation of recreational vehicles maneuverability on forest roads by computer-aided driving analysis. Balt. J. Road Bridge Eng. 11(2): 111–119. https://doi.org/10.3846/bjrbe.2016.13
Akgül, M., Yurtseven, H., Gulci, S., Akay, A.E., 2018: Evaluation of UAV- and GNSS-based DEMs for earthwork volume. Arab. J. Sci. Eng. 43(4): 1893–1909. https://doi.org/10.1007/s13369-017-2811-9
Arıcak, B., Acar, H.H., 2008: The modeling of filling and construction impact areas in building forest roads by using QuickBird satellite image. Kastamonu Univ. J. For. Fac. 8(2): 144–156.
Artun, A., Badenko, V., Volkova, Y., Radaev, A., 2020: Minimizing earthwork volumes by optimizing vertical alignment with linear programming algorithm. E3S Web Conf. 224: 03028. https://doi.org/10.1051/e3sconf/202022403028
Aruga, K., 2005: Tabu search optimization of horizontal and vertical alignments of forest roads. J. For. Res. 10(4): 275–284. https://doi.org/10.1007/s10310-004-0136-5
Aruga, K., Sessions, J., Akay, A.E., 2005: Application of an airborne laser scanner to forest road design with accurate earthwork volumes. J. For. Res. 10(2): 113–123. https://doi.org/10.1007/s10310-004-0116-9
Babapour, R., Naghdi, R., Ghajar, I., Ghodsi, R., 2018: New strategies for estimation of cut and fill areas in road design with different ground cross-section offsets. Scand. J. For. Res. 33(2): 178–187. https://doi.org/10.1080/02827581.2017.1338748
Bayoğlu, S., 1996: Orman Nakliyatının Planlanması [Planning of Forest Transportation]. Institute of Graduate Studies in Sciences, Istanbul University, Istanbul.
Bayoğlu, S., 1997: Orman Transport Tesisleri ve Taşıtları [Forest Transportation Infrastructure and Vehicles]. Faculty of Forestry, Istanbul University, Istanbul.
Baytekin, 2022: Genel Ürün Kataloğu [General Product Catalog]. Baytekin, Istanbul.
Cheng, J., Jiang, L., 2013: Accuracy comparison of roadway earthwork computation between 3D and 2D methods. Procedia Soc. Behav. Sci. 96: 1277–1285. https://doi.org/10.1016/j.sbspro.2013.08.145
Contreras, M., Aracena, P., Chung, W., 2012: Improving accuracy in earthwork volume estimation for proposed forest roads using a high-resolution digital elevation model. Croat. J. For. Eng. 33(1): 125–142
Coulter, E.D., Chung, W., Akay, A.E., Sessions, J., 2002: Forest Road Earthwork Calculations for Linear Road Segment Using a High Resolution Digital Terrain Model Generated from LIDAR Data. In: Precision Forestry. Seattle, Washington.
Demir, M., 2002: Bolu mıntıkasında orman yol şebeke ve nakliyat planlarının bilgisayar ortamında düzenlenmesi [Computer aided design of forest road network and transportation planning in Bolu Region]. J. Fac. For. Istanb. Univ. 52(2): 125–158.
Easa, S.M., 1988a: Estimating pit excavation volume using nonlinear ground profile. J. Surv. Eng. 114(2): 71–83. https://doi.org/10.1061/(ASCE)0733-9453(1988)114:2(71)
Easa, S.M., 1988b: Selection of roadway grades that minimize earthwork cost using linear programming. Transp. Res. Part. A. 22(2): 121–136. https://doi.org/10.1016/0191-2607(88)90024-6
Easa, S.M., 1989: Simplifying roadway cross sections without reducing volume accuracy. Can. J. Civ. Eng. 16(4): 483–488. https://doi.org/10.1139/l89-078
Easa, S.M., 1992a: Discussion of »Cut and fill calculations by modified average‐end‐area method« by James W. Epps and Marion W. Corey. J. Transp. Eng. 118(4): 600–601. https://doi.org/10.1061/(ASCE)0733-947X(1992)118:4(600)
Easa, S.M., 1992b: Estimating earthwork volumes of curved roadways: mathematical model. J. Transp. Eng. 118(6): 834–849. https://doi.org/10.1061/(ASCE)0733-947X(1992)118:6(834)
Easa, S.M., 1992c: Modified prismoidal method for nonlinear ground profiles. Surv. Land. Inf. Syst. 52(1): 13–19.
Easa, S.M., 2003: Estimating earthwork volumes of curved roadways: simulation model. J. Surv. Eng. 129(1): 19–27. https://doi.org/10.1061/(ASCE)0733-9453(2003)129:1(19)
Eliou, N., Gkoutzini, A., Karakikes, I., Gizas, I., Galanis, A., Kaliampetoso, G., 2019 Calculation of Road Projects Earthwork: A Comparison of Methods. In: 5th International Conference on Road and Rail Infrastructure.
Epps, J.W., Corey, M.W., 1990: Cut and fill calculations by modified average‐end‐area method. J. Transp. Eng. 116(5): 683–689. https://doi.org/10.1061/(ASCE)0733-947X(1990)116:5(683)
Erdaş, O., 1997: Orman Yolları [Forest Roads]. Faculty of Forestry, Karadeniz Technical University, Trabzon.
Evren, G., 1994: Toprak İşleri [Earthworks], 2nd edn. Faculty of Civil Engineering, Istanbul Technical University, Istanbul.
GDF, 2008: Orman yolları planlaması, yapımı ve bakımı (292 Sayılı Tebliğ) [Forest road planning, construction and maintenance (Communiqué No. 292)]. General Directorate of Forestry, Ankara.
Gizas, I., 2016: Earthworks Calculation Method Comparison. Master’s thesis, Department of Civil Engineering, University of Thessaly, Volos, Greece.
Gkoutzini, A., 2017: An Investigation of Earthwork Calculation Methods. Master’s thesis, Department of Civil Engineering, University of Thessaly, Volos, Greece.
Goktepe, A.B., Lav, A.H., 2004: Method for optimizing earthwork considering soil properties in the geometric design of highways. J. Surv. Eng. 130(4): 183–190. https://doi.org/10.1061/(ASCE)0733-9453(2004)130:4(183)
Görcelioğlu, E., 2003: Sel ve Çığ Kontrolu [Torrent and Avalanche Control]. Faculty of Forestry, Istanbul University, Istanbul.
Gülci, N., Akay, A.E., Erdaş, O., Gülci, S., 2015: Üretim işlerinin planlanmasında RTK-GPS tabanlı sayısal yükseklik modelinin kullanılması [Forest operations planning by using RTK-GPS based digital elevation model]. J. Fac. For. Istanb. Univ. 65(2): 59–68. https://doi.org/10.17099/jffiu.11545
Gülci, S., Akgül, M., Gülci, N., Demir, M., 2021: A study on using digital terrain models produced by different techniques in determining forest road routes. J. Bartin. Fac. For. 23(2): 1–14. https://doi.org/10.24011/barofd.908019
Gümüş, S., Acar, H.H., Toksoy, D., 2008: Functional forest road network planning by consideration of environmental impact assessment for wood harvesting. Environ. Monit. Assess. 142(1): 109–116. https://doi.org/10.1007/s10661-007-9912-y
Gümüş, S., Acar, H.H., Tunay, M., Ateşoğlu, A., 2003: Calculation of Cut and Fill Volumes by GIS in Forest Roads Projecting. In: XII World Forestry Congress. Quebec City, Canada, 152–153 p.
Gümüş, S., Türk, Y., Arıcak, B., 2015: Investigation of Approximate Cost and Progress Payment in Forest Road Construction Process. Kastamonu Univ. J. For. Fac. 15(1): 6–14. https://doi.org/10.17475/kuofd.97296
Hanzhi, H., 2009: Research on Optimization Analysis of Engineering Earthwork Calculation Method. Hunan University, Hunan, Changsha.
Hickerson, T.F., 1967: Route Location and Design. McGraw-Hill College.
Hintz, C., Vonderohe, A.P., 2011: Comparison of earthwork computation methods. Transp. Res. Rec. 2215(1): 100–104. https://doi.org/10.3141/2215-11
İcifer, B., 1984: Fliyosen’de Ankara ile Etimesgut-Batıkent havzaları arasında uzanan paleosırt [Paleoridge extending between Ankara and Etimesgut-Batıkent basins in the Pliocene]. J. Geol. Eng. 8(3): 33–38.
Karakikes, I., 2012: Road Projects Earthworks Calculation–Method Comparison. Master’s thesis, Department of Civil Engineering, University of Thessaly, Volos, Greece.
Kavanagh, B.F., 2010: Surveying with Construction Applications, 7th ed. Prentice Hall, Upper Saddle River, N.J.
Kim, E., Schonfeld, P., 2001: Estimating Highway Earthwork Cross Sections by Using Vector and Parametric Representation. Transp. Res. Rec. 1772(1): 48–54. https://doi.org/10.3141/1772-06
Liu, Q., Duan, Q., Zhao, P., Ren, H., Duan, H., Liu, G., Wang, Z., Duan, Z., Qin, L., 2021: Summary of calculation methods of engineering earthwork. J. Phys. Conf. Ser. 1802(3): 1–8. https://doi.org/10.1088/1742-6596/1802/3/032002
Matinnia, B., Parsakhoo, A., Mohamadi, J., Jouibary, S.S., 2018: Study of the LiDAR accuracy in mapping forest road alignments and estimating the earthwork volume. J. For. Sci. 64(11): 469–477. https://doi.org/10.17221/87/2018-JFS
Melemez, K., Ateşoğlu, A., Özkan, C., Tunay, M., 2015: Orman yollarının bi̇lgi̇sayar destekli̇ tasarım metodu i̇le projelendi̇ri̇lmesi̇ [To project forest roads by using computer aided design method]. J. Bartin. Fac. For. 17(25–26): 29–41.
Meyer, C.F., Gibson, D.W., 1980: Route Surveying and Design. Series in Civil Engineering-Untraced Series, New York.
Nelson, A., Reuter, H.I., Gessler, P., 2009: Chapter 3 DEM production methods and sources. In: Hengl, T., Reuter, H.I., (eds) Developments in Soil Science. Elsevier, 65–85 p.
NZFOA, 2020: New Zealand Forest Road Engineering Manual 2020. New Zealand Forest Owners Association, Wellington, New Zealand.
Official Gazette, 2005: Büyük Ölçekli Harita ve Harita Bilgileri Üretim Yönetmeliği (Sayı: 25876) [Large Scale Map and Map Information Production Regulation (Issue No. 25876)]. Official Gazette of the Republic of Türkiye, Ankara.
Oloufa, A.A., 1991: Triangulation applications in volume calculation. J. Comput. Civ. Eng. 5(1): 103–119. https://doi.org/10.1061/(ASCE)0887-3801(1991)5:1(103)
Pazhouhan, I., Najafi, A., Rouhani Kamkar, A., Vahidi, J. 2017: Effect of subsurface materials on earthwork operation costs of forest road. Eur. J. For. Eng. 3(2): 44–51.
Reutebuch, S.E., McGaughey, R.J., Andersen, H.E., Carson, W.W., 2003: Accuracy of a high-resolution lidar terrain model under a conifer forest canopy. Can. J. Remote Sens. 29(5): 527–535. https://doi.org/10.5589/m03-022
Seçkin, Ö.B., 2003: Peyzaj Uygulama Tekniği [Landscape Construction Techniques], 2nd edn. Istanbul University, Istanbul.
Şentürk, N., Akgül, M., Öztürk, T., Akay, A.O., 2018: Comparison of topographical map based traditional method and computer-assisted method in calculation of cut-fill volumes in forest roads. J. Bartin. Fac. For. 20(3): 618–626. https://doi.org/10.24011/barofd.467782
Siebert, S., Teizer, J., 2014: Mobile 3D mapping for surveying earthwork projects using an Unmanned Aerial Vehicle (UAV) system. Autom. Constr. 41: 1–14. https://doi.org/10.1016/j.autcon.2014.01.004
Siyam, Y.M., 1987: Precision in cross‐sectional area calculations on earthwork determination. J. Surv. Eng. 113(3): 139–151. https://doi.org/10.1061/(ASCE)0733-9453(1987)113:3(139)
Slattery, K.T., Slattery, D.K., Peterson, J.P., 2012: Road construction earthwork volume calculation using three-dimensional laser scanning. J. Surv. Eng. 138(2): 96–99. https://doi.org/10.1061/(ASCE)SU.1943-5428.0000073
Smith, S.D., Wood, G.S., Gould, M., 2000: A new earthworks estimating methodology. Constr. Manag. Econ. 18(2): 219–228. https://doi.org/10.1080/014461900370843
Stückelberger, J.A., Heinimann, H.R., Burlet, E.C., 2006: Modeling spatial variability in the life-cycle costs of low-volume forest roads. Eur. J. For. Res. 125(4): 377–390. https://doi.org/10.1007/s10342-006-0123-9
Sulistyo, T., 2007: Application of GIS to improve accuracy and save time in cut and fill calculation: a case study of Bunga Club Project PT. Tanjung Pura Resorts Balikpapan. J. Ilm. Politek. 1(1): 57–63.
Tunay, M., Acar, H.H., Ateşoğlu, A., 2001: Orman yolları projelendirmede kazı-dolduru hacimlerinin bilgisayar ortamında hesabı [Calculation of cut-fill volumes in forest road projecting by computer]. J. Bartin. Fac. For. 3(3): 45–58.
Umeda, S., Suzuki, H., Yamaguchi, S., 2007: Considerations in the construction of a spur road network. J. Jpn. For. Eng. Soc. 22(3): 143–152.
Wanasinghe, G.I., De Silva, H., Thennakoon, P.G., Kalugamuwa, K., 2019: Modification for End Area Rule Used in Volume Calculation of Highway Pavements. In: Proceedings of 12th International Research Conference. General Sir John Kotelawala Defence University, Sri Lanka, 249–253 p.
Wen, Y., Yuan, X., Yang, X., Hang, Z., Qi, H., 2021: Research on earthwork calculation based on TIN model. E3S Web. Conf. 248: 03001. https://doi.org/10.1051/e3sconf/202124803001
Zhang, W., Hu, B., Quist, L., 2016: Automatic Identification and Extraction of Forest Road Through Advanced LoG Matching Techniques. In: 2016 IEEE International Geoscience and Remote Sensing Symposium (IGARSS), 799–801 p.
© 2026 by the authors. Submitted for possible open access publication under the
terms and conditions of the Creative Commons Attribution (CC BY) license (http://creativecommons.org/licenses/by/4.0/).
Authors’ addresses:
Hakan Topatan, MSc *
e-mail: hakan.topatan@iuc.edu.tr
Prof. Tolga Öztürk, PhD
e-mail: tozturk@iuc.edu.tr
Istanbul University-Cerrahpaşa
Faculty of Forestry
Department of Forest Engineering
Valide Sultan Cad. No:2
34473, Istanbul
TÜRKİYE
* Corresponding author
Received: February 05, 2026
Accepted: June 06, 2026
Original scientific paper