
Predicting Machine Activity of Forwarders Using J1939 CAN Bus Data and Machine Learning
doi: https://doi.org/10.5552/crojfe.2027.4561
volume: issue, issue:
pp: 16
- Author(s):
-
- Humphrey Patrick
- Harvey Campbell
- Article category:
- Original scientific paper
- Keywords:
- Forestry 4.0, machine learning, forwarder, CAN bus, J1939, machine activity, forest harvesting, New Zealand
Abstract
HTML
As the New Zealand forestry industry progresses toward the implementation of Forestry 4.0 and 5.0 concepts, the use of machine data for operational monitoring and analysis is becoming increasingly valuable. This study investigates the application of machine learning to automate time studies of forwarders by predicting machine activity using Controller Area Network data. Data were collected from two John Deere 1910E forwarders over three harvesting sites (295 cycles) in the South Island of New Zealand. Four machine learning models, Random Forest, Classification and Regression Tree, Long Short-Term Memory, and Gated Recurrent Unit, were trained on data of Forwarder One at an 80:20 (training:testing) split (185 cycles). The models were then further evaluated for generalisability using data of Forwarder Two (110 cycles). Initial trials revealed that machine learning models struggled to distinguish between machine activities such as Loading and Unloading or Driving Loaded and Unloaded, with the neural network models (Long Short-Term Memory and Gated Recurrent Unit) demonstrating superior performance in capturing temporal dependencies. After relabelling and reducing feature complexity, the Gated Recurrent Unit model achieved a validation accuracy of 95.51%, outperforming all other models. Comparison with existing methods from the literature showed that this model provided lower error rates for cycle time, with a percent error of 0.05% and a Root Mean Square Error of 0.02 minutes. At the machine activity level, the model was significantly better, with a decrease in percent error of up to approximately 130% and Root Mean Square Error of up to approximately 1.8 minutes, compared to previous literature. This research demonstrates the feasibility of using machine learning to automate forwarder time studies with high accuracy, providing a scalable and replicable framework that could extend to other forestry machinery. The findings support the integration of these models into Cyber-Physical Systems for real-time monitoring, though challenges such as data access and model generalisation must be addressed to fully realise the benefits of Forestry 4.0.
Predicting Machine Activity of Forwarders Using J1939 CAN Bus Data and Machine Learning
Patrick Humphrey, Campbell Harvey
https://doi.org/10.5552/crojfe.2027.4561
Abstract
As the New Zealand forestry industry progresses toward the implementation of Forestry 4.0 and 5.0 concepts, the use of machine data for operational monitoring and analysis is becoming increasingly valuable. This study investigates the application of machine learning to automate time studies of forwarders by predicting machine activity using Controller Area Network data. Data were collected from two John Deere 1910E forwarders over three harvesting sites (295 cycles) in the South Island of New Zealand. Four machine learning models, Random Forest, Classification and Regression Tree, Long Short-Term Memory, and Gated Recurrent Unit, were trained on data of Forwarder One at an 80:20 (training:testing) split (185 cycles). The models were then further evaluated for generalisability using data of Forwarder Two (110 cycles). Initial trials revealed that machine learning models struggled to distinguish between machine activities such as Loading and Unloading or Driving Loaded and Unloaded, with the neural network models (Long Short-Term Memory and Gated Recurrent Unit) demonstrating superior performance in capturing temporal dependencies. After relabelling and reducing feature complexity, the Gated Recurrent Unit model achieved a validation accuracy of 95.51%, outperforming all other models. Comparison with existing methods from the literature showed that this model provided lower error rates for cycle time, with a percent error of 0.05% and a Root Mean Square Error of 0.02 minutes. At the machine activity level, the model was significantly better, with a decrease in percent error of up to approximately 130% and Root Mean Square Error of up to approximately 1.8 minutes, compared to previous literature. This research demonstrates the feasibility of using machine learning to automate forwarder time studies with high accuracy, providing a scalable and replicable framework that could extend to other forestry machinery. The findings support the integration of these models into Cyber-Physical Systems for real-time monitoring, though challenges such as data access and model generalisation must be addressed to fully realise the benefits of Forestry 4.0.
Keywords: Forestry 4.0, machine learning, forwarder, CAN bus, J1939, machine activity, forest harvesting, New Zealand
1. Introduction
Time studies are a cornerstone of forest operations research, benchmarking incremental productivity changes as operations have developed across the world. As mechanised forest operations implement concepts such as Forestry 4.0 (Feng and Audy 2020) and 5.0 (Holzinger et al. 2024), time studies are also evolving to make use of the data generated by mechanised operations (Palander et al. 2013). Data processing tools such as Machine Learning (ML) are helping to facilitate this automation process (Melander et al. 2020). Modern forestry machines are equipped with a plethora of sensors; monitoring their inner workings, operator inputs, and the machines’ interaction with the environment around them. These sensors are connected in network-like systems within the machine known as the Controller Area Network (CAN). CAN is a serial communication protocol developed by Bosch in the mid-1980s and standardised as ISO 11898 (Spencer and Torres 2023). It has seen widespread adoption, from automotive controls to industrial systems and heavy machinery controls. Spencer et al. (2021) suggest that accessing CAN data allows significant opportunities for advancing the knowledge base within harvesting operations. Reflecting this, literature shows a growing trend towards utilising CAN data for the analysis of machine performance in forest operations. Some studies leverage built-in systems like John Deere’s fleet management system (JDLink), which provides preprocessed outputs such as cycle times, fuel consumption, and machine activity metrics (Bacescu et al. 2022). In contrast, other research leverages CAN data directly from machines (Ala-Ilomäki et al. 2020, Prinz et al. 2021, Munis et al. 2023, Bacescu et al. 2024), enabling more detailed, flexible analyses but requiring significant post-processing and specialised knowledge to interpret the data correctly.
ML is a subset of Artificial Intelligence (AI), where software systems are designed to automatically improve by implementing an iterative learning process (Ayodele 2010). Forest operations research is now seeing a large uptake of ML for processing and analysing large and complex datasets generated by machine sensors (Melander et al. 2020, Munis et al. 2022). Of the various machines involved with forest harvesting, the current literature focuses heavily on predicting the productivity of harvesters (Liski et al. 2020, Gonçalves et al. 2021, Almeida et al. 2024) with minimal focus on predicting machine activities during the machine workday i.e., an elemental time study. This study aims to bridge this gap in the literature by using ML to develop an automatic elemental time study model. McDonald and Fulton (2005) outline the four key requirements for automatic time study systems:
- easy to install, reducing downtime for machine participating in study
- compatible with a broad range of machinery systems without needing major adjustments for each machine or location
- survive the harsh conditions present in harvesting operations
- produce data equivalent to that of a skilled field crew.
Comparisons can be made to ML-based processing of machinery data as seen in industries such as manufacturing, agriculture, mining and transport. Borith et al. (2020) presented an ML method to predict machine inactivity from data gathered from the machine’s programmable logic controller sensors. The authors trained several ML models such as Decision Tree (DT), k-nearest neighbours, Random Forest (RF), and linear Support Vector Machine (SVM), with the SVM model achieving the highest accuracy (98%). Bettucci et al. (2024) utilised CAN and Global Navigation Satellite System (GNSS) data with ML algorithms such as Gradient Boosting (GB), RF, DT, and SVM to predict agricultural machinery status (Idle, Moving but not performing any specific task, Headland turns and Working inside the field) during ploughing operations, achieving over 98% accuracy. Waleed et al. (2021) applied similar ML algorithms (DT, RF, and GB) to classify farm machinery implements using accelerometer and gyroscope data, with RF yielding the highest accuracy. Collectively, these studies show that high prediction accuracy is achievable with »traditional« ML algorithms applied to machine CAN datasets.
Forwarders represent approximately 8% of extraction machinery used in New Zealand (Visser 2023). Previous research has established distinct machine activities (or time elements) for forwarders including Idle, Driving Unloaded, Loading, Driving Loaded, and Unloading (Proto et al. 2018). Compared to the farm machinery examined in the literature above, forwarders exhibit greater complexity in their activity patterns, due to the interplay of the unloading and loading elements. Having regard to the second requirement from McDonald and Fulton (2005), models should be capable of generalising across a range of different forwarders. Deep learning (DL), a subset of ML, offers a promising avenue, as algorithms such as Recurrent Neural Networks (RNNs) can learn hidden patterns within the datasets and handle the temporal dependencies inherent in time-series data which the traditional ML algorithms cannot do (Zhang and Zhuo 2024).
RNNs are specialised for sequential data where the order of inputs is important, such as in time-series analysis. This allows the model to capture temporal dependencies within the data it receives. This is important for forwarders because the current activity of the machine is highly likely to depend on preceding states. While RNNs have had limited application in predicting machine activity in forestry harvesting operations, they have been applied in forest crop modelling. Zhang and Zhuo (2024) used an RNN to estimate the aboveground biomass in tropical forests. The authors used Landsat time-series data to capture temporal dependencies in the data. The model architecture combined the use of a Long Short-Term Memory (LSTM) with a Feed-Forward Network, resulting in significantly higher accuracy (R²=0.63) than RF (R²=0.45) and linear regression (R²=0.34) models. RNNs are also widely used in healthcare, where patient histories and medical records are inherently sequential/time-dependent. Hama et al. (2025) conducted a systematic review of the use of sequential data in deep learning models, concluding that such approaches show strong potential in predicting the health outcomes of patients. RNNs, especially LSTM-based models, were found to be the most frequently used, appearing in 56% of the studies reviewed. Beyond healthcare, these models have been applied to learn temporal patterns of wear or impending failure of machines. Eang and Lee (2025) illustrated this with their Convolutional Neural Networks (CNNs) with RNNs for predictive maintenance and fault detection in direct current motor drives. Their CNN–RNN hybrid achieved the highest accuracy (98%) among several trained models, outperforming traditional ML algorithms such as RF and GB. These literature show that RNN-based models can outperform traditional ML algorithms in time-series forecasting and learning temporal dependencies in historical data. Given the sequential nature of CAN data from forestry machinery, these findings suggest that RNNs could be effective for predicting machine activity based on this data.
This study builds on the work of McDonald and Fulton (2005), developing ML (used throughout this study as an umbrella term encompassing DL) models that predict the activity of a forwarder using CAN data from real world operations. The reviewed literature demonstrates that both traditional ML and DL approaches can be effective in distinguishing patterns within complex and multidimensional datasets. Accordingly, this analysis will evaluate both types of learning discussed to identify not only the most accurate model, but also to inform which approach should be prioritised for future applications to other machinery in forest operations.
2. Materials and Methods
2.1 Study Location and Machine Specifications
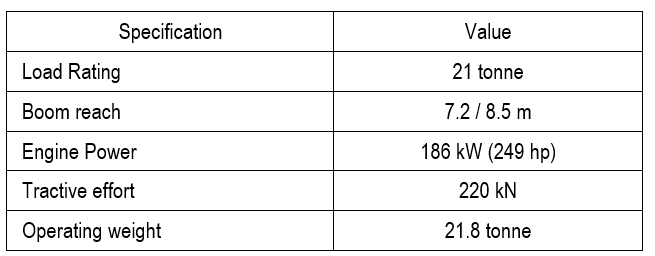
Two forwarders, each with a different operator, were used for data collection. Both Forwarders were John Deere 1910E models. Machine specifications are detailed below in Table 1. Data from Forwarder One was collected over two Pinus radiata plantation harvesting sites. The first site was in Balmoral Forest (42° 49' 46.1892'' S, 172° 42' 43.5456'' E), Canterbury, New Zealand. The terrain was flat, and conditions were dry. The second site was Mt Thomas Forest (43° 12' 1.5588'' S, 172° 15' 5.3568'' E), Canterbury with rolling terrain and conditions were also dry. Data for Forwarder Two was collected in Beaumont Forest (45° 55' 36.12'' S, 169° 26' 20.04'' E), Otago, New Zealand. The machine operated in a mixed stand of Pinus radiata and Pseudotsuga menziesii on steep terrain and wet ground conditions.
Table 1 John Deere 1910E Forwarder specifications
2.2 Data Collection
CAN data were collected from the forwarders using a CANEdge2 datalogger (CSS Electronics 2025) connected to the diagnostic port of each forwarder. The data were stored in 50 MB MF4-format files on the SD (Secure Digital) card of the logger. Data were captured over five full workdays at Balmoral Forest, seven at Mt Thomas Forest, and eight at Beaumont Forest, totalling 295 load/unload cycles. After finishing the data collection at each site, the files were uploaded to a local desktop to be converted into human-readable format. The raw CAN bus data were then decoded using a Python 3.10 script in conjunction with the SAE (Society of Automotive Engineers) J1939 DBC (Database CAN) file (SAE International 2022) and asammdf (Hrisca 2024) software package. This process converted the original MF4 file to CSV (Comma Separated Values) format at approximately 333 Hz frequency. The resulting dataset contained over 100 variables ranging from engine parameters to the speed of the forwarder. The workflow of the methodology is shown in Fig. 3.
2.3 Data Processing and Labelling
The initial frequency of the data (333 Hz) resulted in large file sizes and, therefore, excessive computing times that were impractical for this study. A frequency of 1 Hz (Bettucci et al. 2024) was selected for the initial dataset to balance computational demands with accuracy, by averaging the data points within each second. Due to the file size limit (50 MB), the 1 Hz data were split across multiple files, resulting in duplicate first and last entries in the TimeStamp variable. These duplicate timestamps were corrected by retaining only the first occurrence. Significant outliers in the CAN data, potentially caused by communication or decoding errors, were identified and removed through filtering and manual inspection of the data. These outliers mainly occurred during the startup or shutdown of the forwarder. For example, on startup both the Engine Fuel and Oil Pressure variables spike well over their normal operating range. NaN (Not a Number) values appeared in the dataset when the engine was off but the ignition was still on, as the data logger continued to collect GNSS data while only limited CAN signals were available on the bus. These missing values were imputed using backfill and forward-fill methods, based on the nearest valid observations (Wen and Li 2023, Agarwal et al. 2024). This was done as the two DL models used in this study are unable to explicitly handle missing data (Strauman et al. 2018).
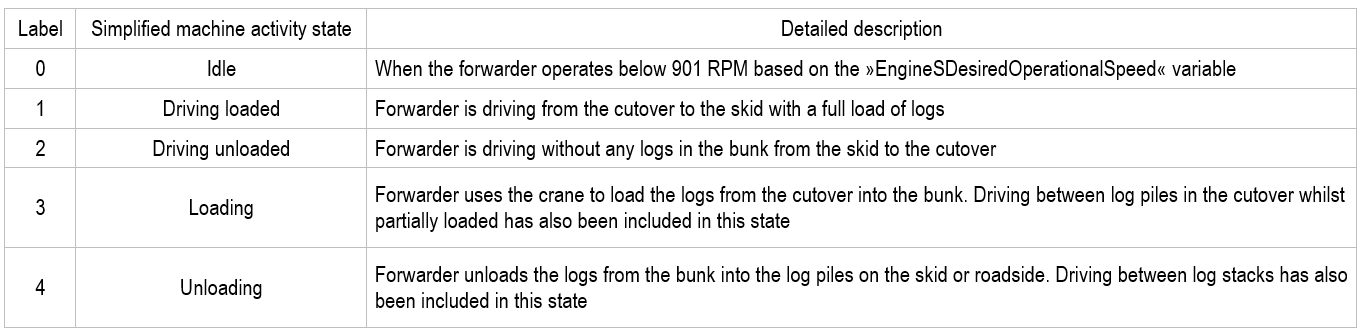
The 1 Hz dataset was subdivided into separate workday CSVs to facilitate manual labelling of machine activities. Machine activities were labelled (Fig. 1) for ML training by inspecting engine RPM (Revolutions Per Minute), Latitude/Longitude coordinates, and the operators’ crane arm joystick movements. The machine activity »Idle« was defined using an engine RPM threshold. Any values where »EngineSDesiredOperationalSpeed« was less than 901 RPM (the idle RPM for these two forwarders is 900) were labelled »Idle«. Crane arm joystick movements with the machine located in the cutover were recorded as »Loading« and joystick movements at skid sites (manually checked with onsite visits) were labelled as »Unloading«. »Driving Loaded« and »Driving Unloaded« states were then determined from the remaining unlabelled data by inspecting the preceding Loading or Unloading activity. The machine activity was then encoded using the integer labels in Table 2. Each cycle was manually checked for accuracy using GPS plots as seen in Fig. 1 and by assessing the crane path during loading and unloading through plots. All cycles that could not be confidently vetted were removed and not used for training or validation. Following completion of the data labelling process, a total of 295 cycles were identified, comprising 185 from Forwarder One and 110 from Forwarder Two.
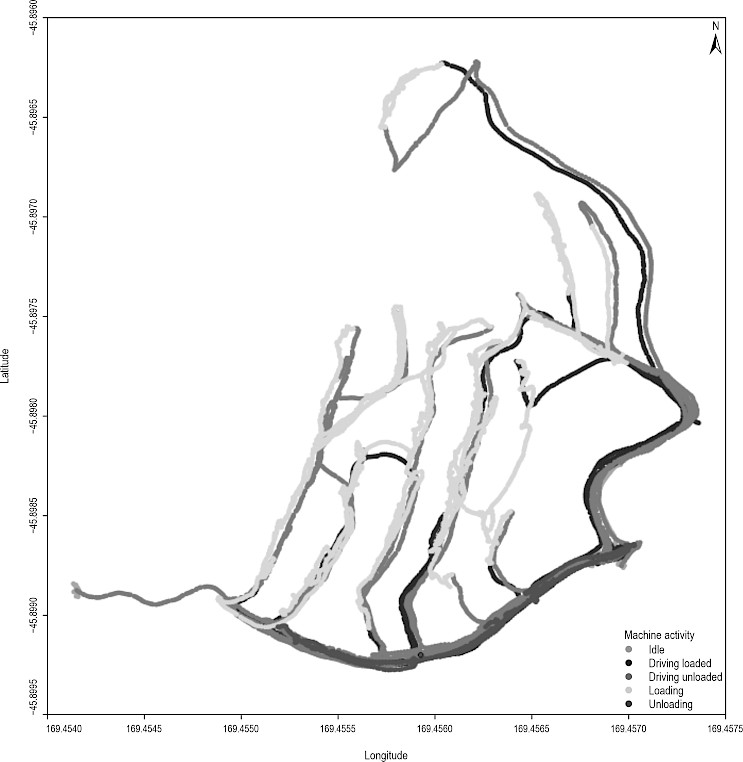
Fig. 1 Machine activity (labelled) GPS plot for Forwarder Two in Beaumont Forest over one full workday
Table 2 Labels for classification of forwarder machine activity
2.4 Machine Learning Analysis
An ML analysis was then conducted to predict the forwarder machine activity states. Four ML models were selected for the analysis. Random Forest and Classification and Regression Tree (CART) were selected as the traditional models. Long Short-Term Memory and Gated Recurrent Unit (GRU) were selected as the two DL models. These models were trained and tested on 1 Hz dataset of Forwarder One; the models were then validated using the 1 Hz dataset from Forwarder Two. This ensured that the ability of each model to generalise across different environmental conditions, different operators, and different machine settings could be measured. Consequently, if a model achieves a high accuracy score in the validation analysis, it can be applied with confidence across multiple forwarders of the same model. In contrast, if both Forwarder One and Two datasets were used for training, the model’s ability to generalise to unseen data could not be properly evaluated.
Both the CART and RF models were created in Python 3.10 using the Scikit-learn library (Pedregosa et al. 2011), DecisionTreeClassifier, and RandomForestClassifier classes, respectively. For hyperparameter tuning, both models used GASearchCV from the sklearn-genetic-opt package (Arenas 2026). The genetic algorithm had a population size of 50 with 20 generations to evolve, a mutation probability of 35%, and five-fold cross validation. The training dataset (Forwarder One) was split into 80% training and 20% testing (Géron 2019).
The two DL models, GRU and LSTM, were created in Python 3.10 using PyTorch (Paszke et al. 2019), GRU Classifier and LSTM Classifier classes, respectively. Both models used »Adam« as the optimiser and »Optuna« for the hyperparameter tuning (Akiba et al. 2019). The hyperparameters were: hidden size, number of layers, learning rate, dropout and batch size. The Optuna optimisation study was set for 500 trials with each consisting of ten epochs where loss was minimised. Once the optimisation study was completed the best model was retrained for a maximum of 500 epochs, with a learning rate scheduler to reduce the learning rate on a plateau with a patience of five and a threshold of 0.01. An early stop function was also added with a patience of ten.
The four models were trained on a desktop computer with the following specifications:
- CPU: Intel Core i7-12700
- GPU: NVIDIA GeForce RTX 3080 Ti with 12 GB VRAM
- RAM: 32 GB DDR4
- Storage: 2 TB NVMe SSD
The outputs of the four ML models were evaluated using four metrics (Eqs. 1–4):
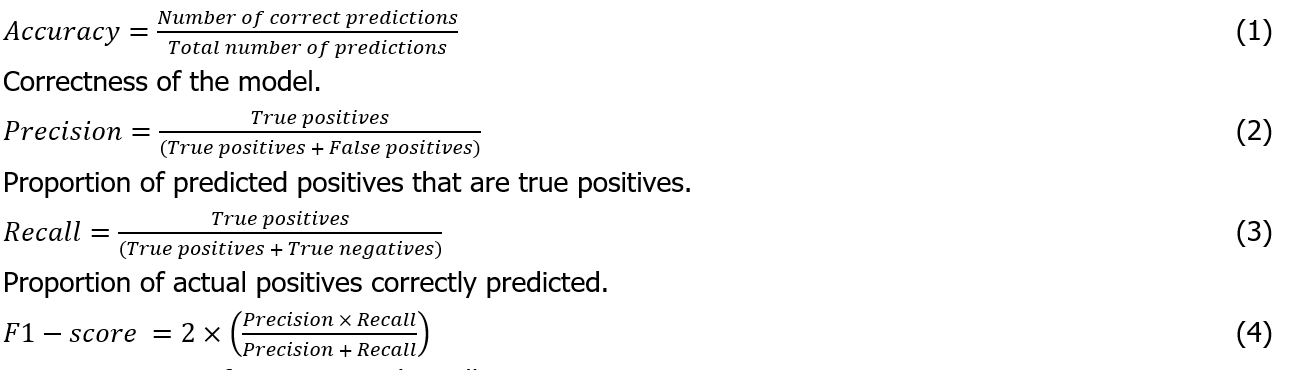
Harmonic mean of precision and recall.
Due to the forwarders spending far longer »Loading« than the other operational states, there are significantly more instances of loading in the training dataset. To avoid bias in the results, the macro average of the evaluation metrics was used (Sokolova and Lapalme 2009).
2.5 Feature Selection and Extraction
Results from CART and RF feature importance (Fig. 2) analyses using the permutation importance method (sklearn.inspection.permutation_importance) (Pedregosa et al. 2011) combined with domain expertise and ML trials enabled the refinement of the 1 Hz raw dataset by keeping relevant features and removing redundant ones. This was done to determine the effects that certain parameters have on the accuracy of the models, such as whether the engine parameters were consistent across different machines and environments. This process was used to refine the datasets used for training. The raw 1 Hz dataset was transformed into the following datasets:
Dataset One
All the available features collected from the machine CAN bus and GNSS device. Initial feature selection removed redundant variables such as Month, Year, GPS Position, and binary columns which supplement some features, leaving 29 variables in the dataset.
Dataset Two
A reduction from 29 to 16 variables selected by the feature importance analysis, focusing on the engine parameters with clear changes between machine activity states and removing joystick movements such as steering, but retaining crane arm and grapple joystick movements.
Dataset Three
Designed to address the overfitting observed in Datasets One and Two. The dataset only contained vehicle speed, crane arm and grapple joystick variables.
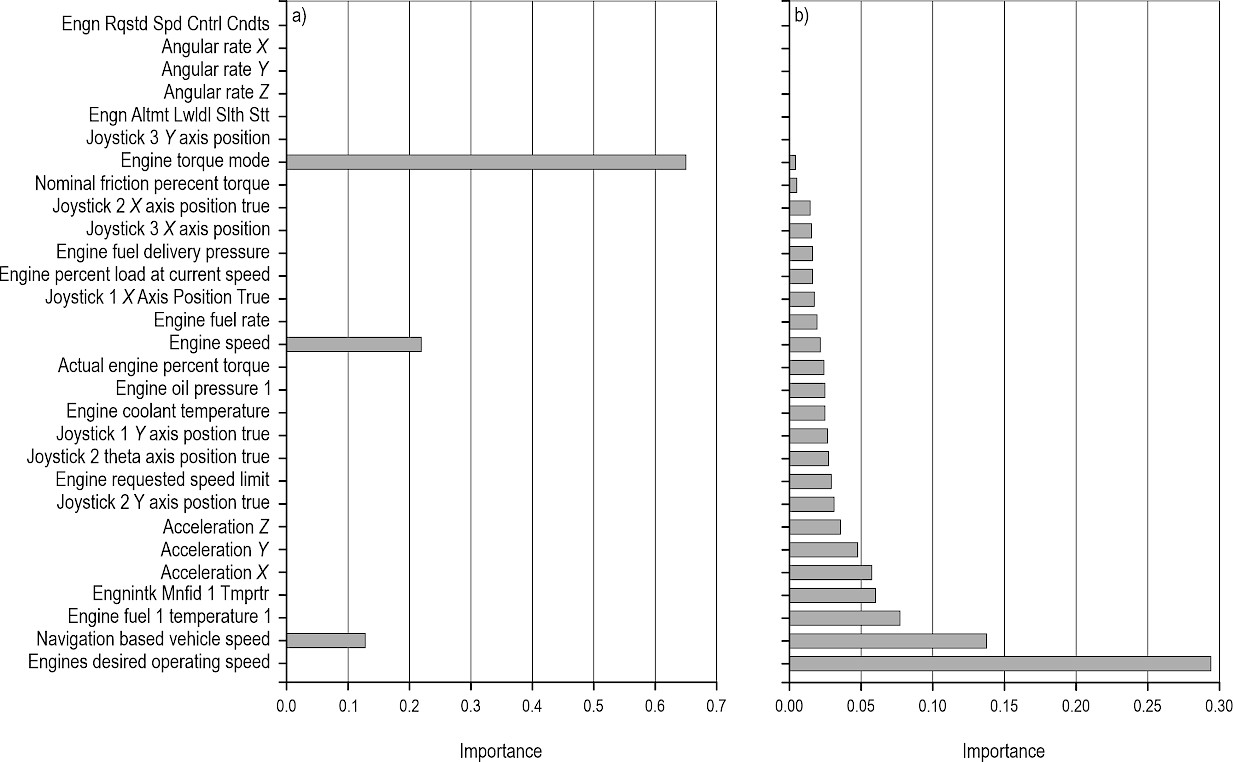
Fig. 2 Dataset One feature importance for CART (a) and RF (b) models
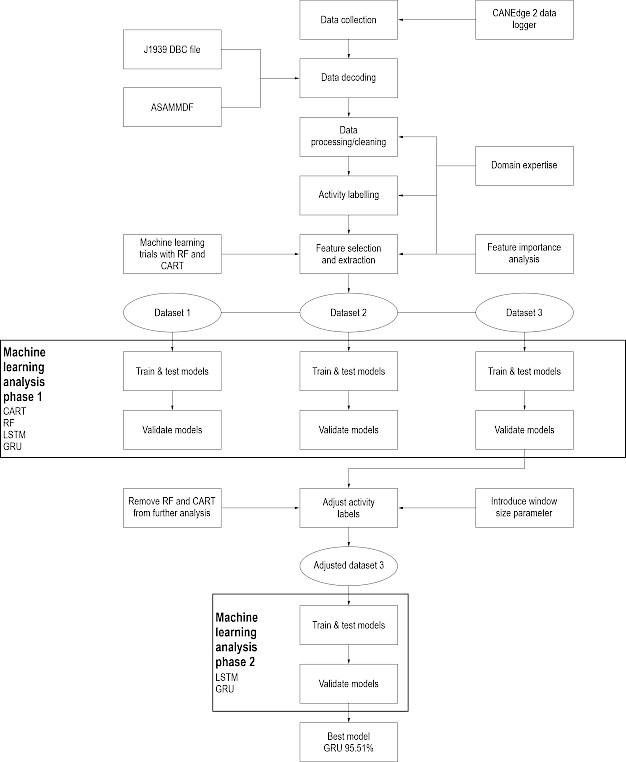
Fig. 3 Methodology and results workflow chart (5 Hz ML training and validation process not shown)
3. Results
Table 3 summarises the training results obtained from each ML algorithm. A general trend observed across all models is a decrease in training accuracy when transitioning from Datasets One to Three. This is primarily due to an increase in misclassifications between Loading/Unloading and between Driving Loaded/Unloaded. For example, the RF model showed 3956 additional misclassifications between Driving Unloaded and Driving Loaded (a 28.1% increase). Similarly, confusion between Loading and Unloading rose by 5532 instances, representing a 13.4% increase in misclassifications. This suggests that engine parameters (such as EngineSpeed and EngineFuelTemperature variables) in Datasets One and Two may play a role in distinguishing the machine activity at the training stage.
The CART algorithm exhibited the lowest performance of the four models, achieving a maximum training accuracy of 64.17% on Dataset One. However, this accuracy was significantly skewed by the model’s high predictive accuracy for the Idle activity, yielding an F1-score of 98.58%, while completely failing to correctly predict instances of Driving Loaded and Unloading. As seen in Table 4, this limitation led to a notably low validation accuracy of 31.08%. Interestingly, for Datasets Two and Three, accuracy slightly improved from training to validation stages by 3.43% and 4.06%, respectively, but the algorithm still failed to identify any instances of Driving Loaded and Unloading.
The RF algorithm similarly achieved its highest training accuracy (91.35%) when trained on Dataset One; however, this decreased significantly during validation to 64.26% (see Tables 3 and 4). Despite achieving perfect prediction for Idle, RF struggled to differentiate Loading from Unloading, and Driving Loaded from Unloaded similar to the CART algorithm. The second RF model (trained on Dataset Two) displayed better validation performance, reaching an accuracy of 71.8; however, this is again skewed due to the excellent Idle state prediction performance.
The LSTM model demonstrated notably higher training accuracies compared to CART and RF. Training on Dataset Two resulted in the highest training accuracy (98.16%), but this dropped to 33.84% upon validation. Dataset One similarly showed a considerable decrease from 95.52% to 63.72%. Like CART and RF performances, LSTM struggled to differentiate between the two Driving activities and Loading/Unloading. Interestingly, the LSTM model trained on Dataset Three, although initially exhibiting lower training accuracy, achieved relatively high validation accuracy (80.25%). While LSTM still faced difficulty distinguishing Driving states (F1-scores: 54.21 for loaded and 49.05 for unloaded), it significantly improved in differentiating Loading and Unloading states (F1-scores: 86.42 and 73.47, respectively).
The GRU algorithm followed a similar pattern to LSTM, achieving exceptionally high training accuracies (>99%) on both Datasets One and Two. Yet, these high accuracies did not translate effectively during validation, decreasing dramatically to 17.87% (Dataset One) and 54.42% (Dataset Two). Conversely, the model trained on Dataset Three, which had the lowest training accuracy, had the highest validation accuracy (79.84%). The GRU model slightly outperformed LSTM in distinguishing Loading (F1-score: 86.83%) and Unloading activities (F1-score: 76.64%) but also struggled to differentiate Driving activities.
The results from the initial machine learning trial revealed several important insights. First, engine parameters such as engine speed and oil pressure differed materially between the two forwarders, despite being identical models. This variation likely contributed to the overfitting observed when validating models on data from the second forwarder. Inspection of the data showed that during Loading and Unloading activities, Forwarder One maintained an approximately constant engine speed of 1400 RPM, while Forwarder Two operated around 1600 RPM. Similarly, the EngineFuelTemperature variable was found to be of high importance for model training (Fig. 2). However, it was discovered to contribute to model overfitting. EngineFuelTemperature increased progressively throughout the workday as the engine warmed, creating a temporal trend that was unrelated to machine activity states. As a result, the models learned to associate temperature values with specific times or operational phases (i.e., early morning or after a lunch break) rather than the underlying activity itself. While this improved performance on the training dataset, it reduced generalisation performance to the validation dataset, where temperature profiles differed. Given these operational differences and the poor results shown in Tables 3 and 4, both Datasets One and Two were excluded from further testing. Second, both CART and RF algorithms consistently struggled to differentiate Loading and Unloading activities, often failing to predict Unloading altogether. As a result, these algorithms were also excluded from subsequent testing.
Finally, considerable misclassification was observed between Loading and Driving activities, likely due to brief driving periods occurring within cutover and skid site areas. To address this, the Driving Loaded and Driving Unloaded activities were combined into a single »Driving« category, where distinctions can be made later in post-processing, based on the previous activity. For example, if the predicted labels go from Unloading to Driving, the driving labels can then be reclassified as Driving Unloaded with a simple state transition logic. Additionally, Loading and Unloading activities without active crane arm joystick inputs were reclassified as Driving. The Idle state was also merged into this broader Driving category, as it can easily be distinguished in post-processing using the »EngineSDesiredOperationalSpeed« variable. This approach aimed to improve the model’s ability to distinguish true Loading/Unloading events, specifically improving the distinction between the unloading and loading joystick movements. This reduction in the number of activities the model has to predict allows it to focus more closely on these two activities. A summary of the adjusted labelling schema is included in Table 5. Furthermore, a new hyperparameter, »window size«, ranging from ten seconds to two minutes, was introduced into the Optuna hyperparameter optimisation, allowing the DL models to capture temporal context over varying sequence lengths when differentiating between crane arm joystick activity patterns.
Table 3 1 Hz training and testing results for datasets One, Two and Three
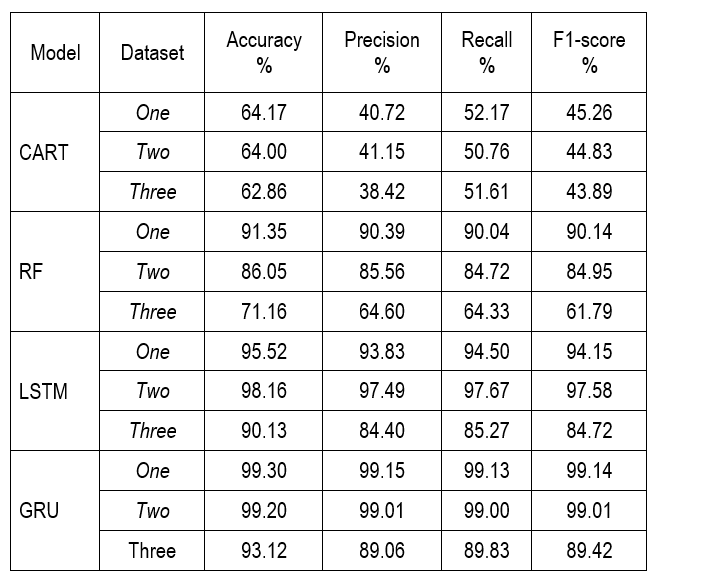
Table 4 1 Hz Validation results for datasets One, Two and Three
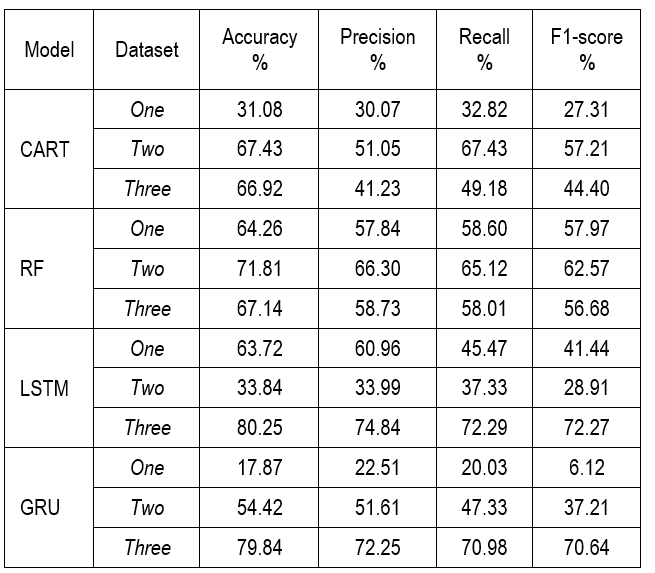
Table 5 Adjusted forwarder activity labels
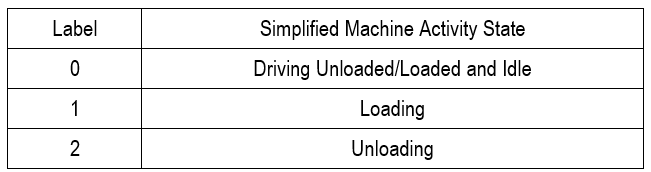
Table 6 presents the training results for the re-labelled dataset using GRU and LSTM algorithms. Compared to the original dataset labelling (Table 3), training accuracy improved significantly from 90.13% to 98.05% for LSTM, and from 93.12% to 98.22% for GRU. This increase was expected, as the simplified states when combined with Dataset Three better aligned with the input variables and the introduction of the window size hyperparameter.
Upon validation, both models also demonstrated improved performance. The LSTM model showed an increase of approximately 5.7% in validation accuracy (Table 7). However, as illustrated in Fig. 4, notable misclassifications remained between the Loading and Unloading activities. This is further reflected in the precision and recall metrics: the Unloading class had a precision of 58.15%, while the Loading class had a recall of 68.99%. These results suggest possible overfitting during training, particularly when compared to performance on the original dataset, where both precision and recall for these states were higher.
The GRU model performed well, achieving a validation accuracy of 95.51%, well surpassing the results of the LSTM model. It demonstrated strong precision and recall across most classes, with F1-scores of 97.87% for the Driving/Idle activities and 94.74% for Loading. While Unloading showed high precision (94.44%), its recall was comparatively lower at 87.32%, making it the least consistent among the three. Nevertheless, GRU proved to be an effective model for predicting forwarder operational states.
A follow-up experiment assessed whether removing the vehicle speed variable would impact model accuracy. The retrained GRU model achieved a slightly higher training accuracy of 98.28%, but validation accuracy dropped to 91.59%. This drop was primarily due to reduced precision for the Unloading activity (74.60%), though recall improved slightly. The Loading activity also experienced a significant decrease in F1-score to 89.09%, driven by a recall drop from 95.18% to 84.34%. In contrast, the LSTM model without the vehicle speed variable had a training accuracy of 97.79% but a significantly lower validation accuracy of 77.55%. This drop was largely due to severe misclassification between Loading and Unloading states, with respective F1-scores of 59.19% and 62.55%. This drop in accuracy could be attributed to the model recognising the pattern of short increases in vehicle speed when the forwarder drives from one pile to another in the cutover from the previous test. However, in this test the speed variable was removed, potentially making it more difficult to distinguish between Loading and Unloading activities.
Table 6 1 Hz Training and testing results for adjusted dataset three
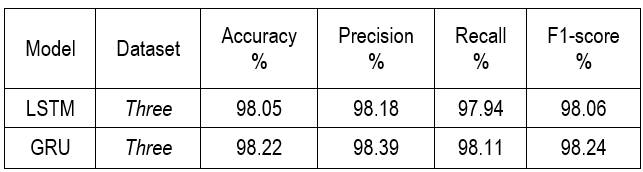
Table 7 1 Hz validation results for adjusted dataset three
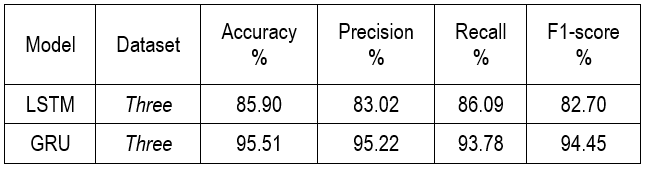
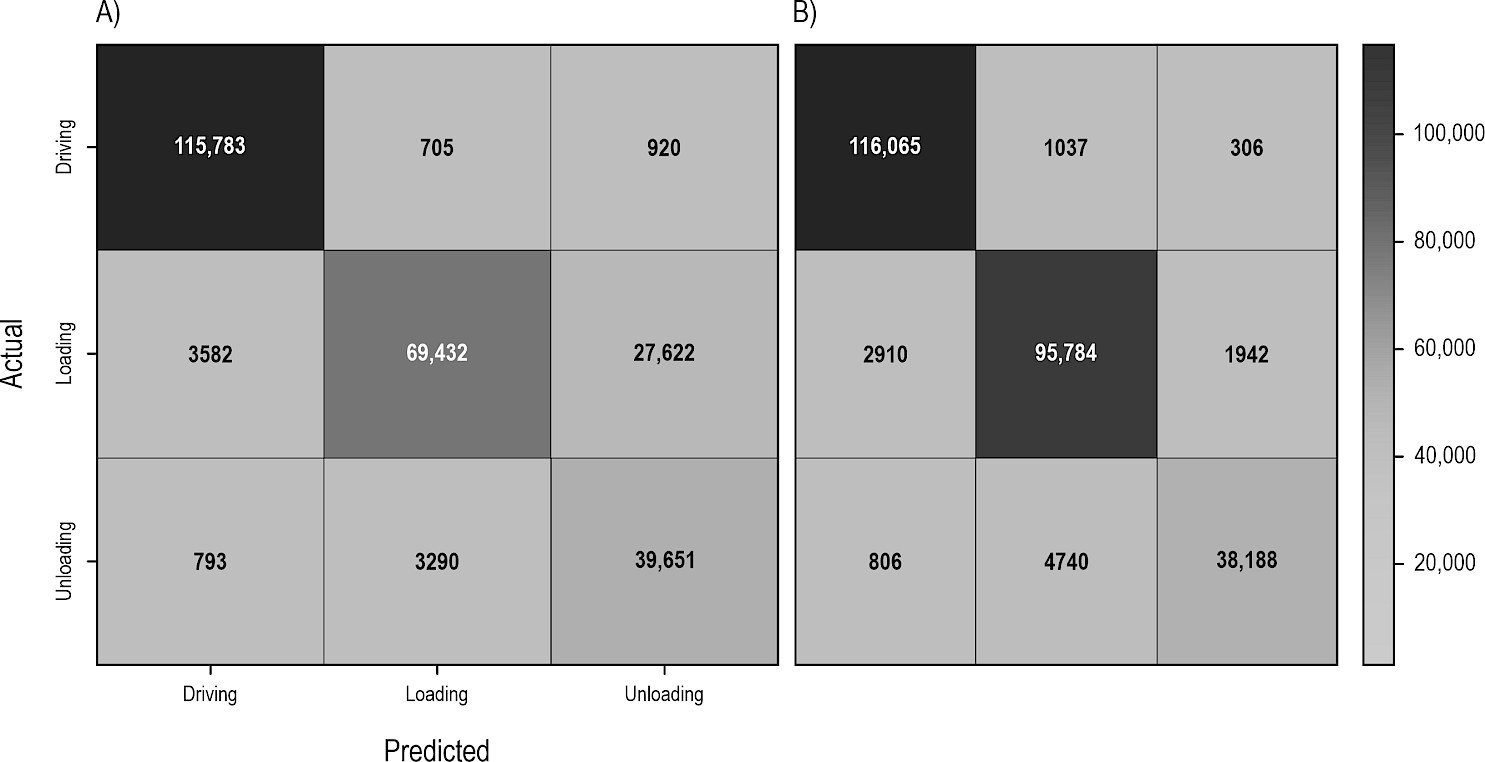
Fig. 4 Confusion Matrices for (A) LSTM Model and (B) GRU Model trained on adjusted dataset three
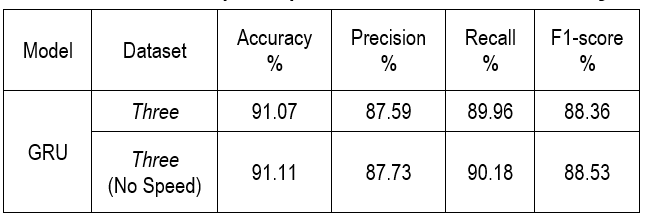
Overall, both GRU models trained on the re-labelled dataset demonstrated strong predictive capabilities. However, persistent misclassification of the Unloading activity remains a limitation. One plausible explanation is the data sampling frequency; at 1 Hz, the model may fail to capture subtle distinctions between Loading and Unloading joystick movement patterns. To address this, two GRU models were trained on 5 Hz frequency CAN data. However, due to the high computational load, the Optuna hyperparameter tuning process was adjusted compared to the 1 Hz trials. Number of trials were reduced from 500 to 100, number of layers reduced from three to two, the batch size limit lowered from 512 to 128, and approximately one third of the dataset was used for training. Once the optimal hyperparameters were found, the model was then trained on the entire 5 Hz dataset.
The results for 5 Hz frequency datasets are presented in Tables 8 and 9. Compared to the 1 Hz frequency analysis, training accuracy increased only marginally. However, when validated, the accuracy dropped to approximately 91.1% for both datasets, with and without the speed parameter. This shows that an increase in frequency did not increase the accuracy of the predictions as previously predicted. Interestingly, the dataset without the speed parameter achieved slightly higher validation accuracy opposite to what was observed in the 1 Hz frequency analysis. Overall, the effect of increased data frequency remains inconclusive due to the restricted hyperparameter optimisation and reduced training dataset size.
Table 8 5 Hz frequency training and testing results for adjusted dataset three
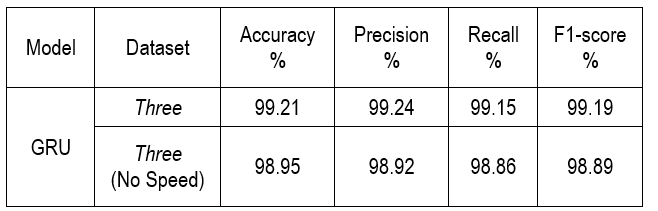
Table 9 5 Hz frequency validation results for adjusted dataset three
4. Discussion
The approach used in this study is intended to meet the four criteria outlined by McDonald and Fulton (2005). The hardware for the approach and its installation is straightforward: the CANEdge2 datalogger can be fitted to most machines via the diagnostic port or by direct connection to the CAN-H and CAN-L wires. The CAN bus is engineered for harsh operating environments and a main contributor as to why it is widely adopted in automotive and heavy-machinery sectors. Its built-in error-detection system provides accurate and reliable data, which can often include supplementary variables to confirm the accuracy of the primary signals. The logger’s small size also enables unobtrusive placement within the machine, ensuring it is away from the operator. These features of the proposed methodology indicate that it satisfies McDonald and Fulton’s first and third criteria.
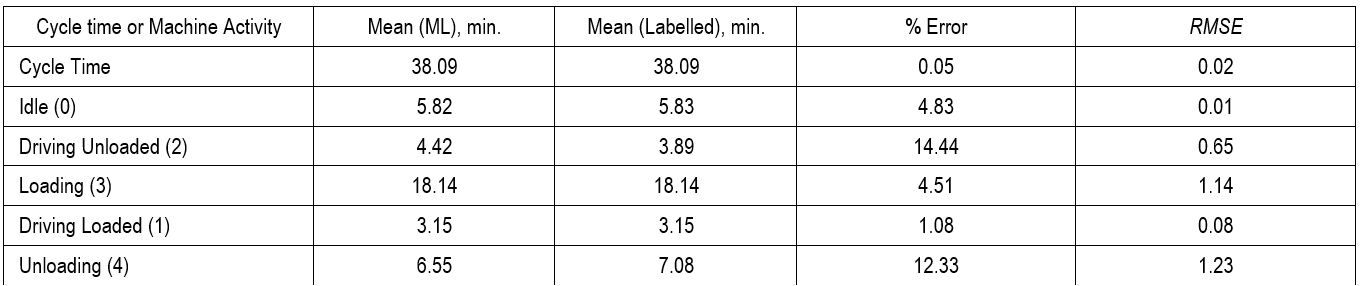
As previously noted, there is limited literature on applying ML to predict the activity states of forestry machinery. However, research on automated time studies does exist. Strandgard and Mitchell (2015) proposed automating forwarder time studies using GPS and vibration sensors. Their method achieved high accuracy for cycle time – less than one second difference relative to manual time studies – while elemental (machine activity) time study performance was substantially poorer. To enable comparison with their approach, we calculated percent error and Root Mean Square Error (RMSE) for the 95.51% accuracy GRU model predictions (Table 7) because Strandgard and Mitchell (2015) used these metrics to evaluate their method (Table 10). The analysis used the GRU activity state predictions of the 110 cycles in the validation dataset (Forwarder Two), with post-processing that mapped the three predicted activities (from adjusted dataset, Table 5) back to the original five (Table 2) to ensure comparison with Strandgard and Mitchell (2015) (Fig. 5). Loading and Unloading observations with no recorded joystick values were reverted from Machine Activity 0 back to their original labels (either 3 or 4; not shown in Fig. 5) only when they were correctly classified as 0; otherwise, they were left unchanged. This adjustment was made to allow a fair comparison between this study and the work of Strandgard and Mitchell.
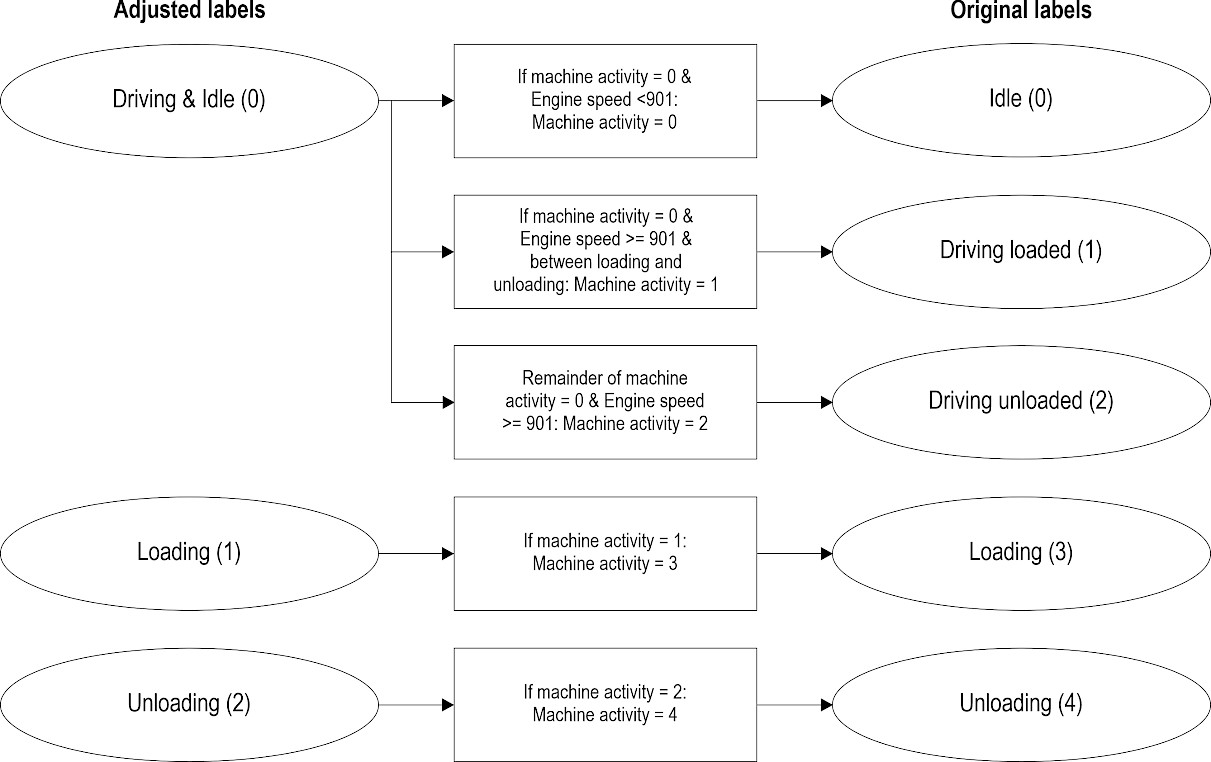
Fig. 5 Flowchart of post-processing for comparison analysis with Strandgard and Mitchell (2015)
For cycle time, our method yielded a percent error of 0.05% and an RMSE of 0.02 minutes, compared with 2.9% and 0.48 minutes reported by Strandgard and Mitchell (2015). For machine activity, the GRU model outperformed the authors’ method across all activities; the largest difference was for driving loaded, with a 129.7% difference in percent error and a 1.82-minute difference in RMSE. Unloading RMSE was the closest between the two studies, differing by 0.17 minutes, which is consistent with unloading having the lowest recall in our model (87.32%). Based on these results, and an overall model accuracy of 95.51%, the GRU model is considered to have satisfied McDonald and Fulton’s fourth criterion. It is important to note that the accuracy of the labelled data could not be independently verified, as it was not feasible to conduct manual time studies, nor would such a study generate a »perfect« baseline dataset for the large number of cycles in the dataset. However, the data are assumed to be comparable in accuracy to manually collected observations, as any cycles that could not be confidently labelled were excluded from both the training and validation datasets.
Table 10 Mean of % error and RMSE of cycle times and machine activities (best model (GRU) against validation labels)
McDonald and Fulton’s second criterion requires broad applicability across machine types. This remains challenging for both GPS- and CAN-based approaches. Although CAN bus systems and the J1939 protocol are common across most harvesting machinery, access to key joystick signals may be restricted behind OEM-proprietary Parameter Group Numbers (PGNs), complicating universal deployment of time-study hardware/software systems and warranting investigation for each machine type and brand. In this study, the forwarders were identical, and used a mixture of public and proprietary CAN Identifiers. While more than 100 variables were decoded via J1939 standard database CAN file, numerous CAN identifiers remained inaccessible, limiting visibility into internal machine operations and potentially constraining the training of high-accuracy, generalisable models.
A notable advantage of the CAN-based ML/DL approach over the GPS-based approach in terms of applicability, is that it does not require geofencing or manual delineation of cutover and skid sites to detect forwarder activity states. This is especially important when forwarders unload along roads rather than at skid sites, an edge case that could hinder the accuracy of GPS-based methods if such locations are not defined in the original mapping.
An additional limitation is the limited understanding of how joystick inputs map to the forwarder’s crane motion. In particular, the relationships between joystick data and the kinematics of the boom and grapple – such as ramp rates, damping, and positional feedback – are poorly characterised. Humphrey et al. (2026) attempted to reverse-engineer these dynamics from joystick activity during forwarder loading cycles; however, their approach required extensive pre- and post-processing, had to be reset each cycle, and assumed operators returned the grapple to a consistent position after each loading state. Direct access to grapple position and boom/crane angle data during loading and unloading would substantially improve model robustness and the classification of these states.
Although forwarders primarily transport logs from the cutover to the skid site, they occasionally perform other tasks such as loading trucks or repositioning logs at the skid. These activities were not explicitly validated in this study, and the model is likely to misclassify them as mixtures of Loading and Unloading. To address this, future models could be trained to detect joystick-activity patterns that deviate from typical Loading/Unloading activities and assign them to a distinct operational activity. One strategy is to break down Loading and Unloading into individual actions as in Humphrey et al. (2026) who analysed activity on a per-grab basis. Training on individual action sequences may enhance robustness and improve Unloading predictions, which were comparatively weak. Techniques such as Dynamic Time Warping (Kim et al. 2018) represent a promising direction for future research.
There is also the possibility of improving the hyperparameter optimisation in future research. Sensitivity to hyperparameter tuning was assessed for all four models using a hyperparameter importance analysis built into the Optuna package. On average, the learning rate emerged as the most influential parameter, accounting for 43.3% of the overall importance, followed by sequence window size at 33.0%. Batch size and hidden size contributed similarly, at 9.5% and 9.7%, respectively. The number of layers had the least effect, with a contribution of only 4.5%. More detailed testing of learning rate and sequence window size in future work may lead to improved model performance. This could also be extended to include the trialling of different learning rate schedulers and early stopping functions.
This study shows that DL can infer forwarder activities, achieving greater than 95% accuracy. The methodology provides a reproducible, stepwise workflow that can be adapted to other machines (e.g., skidders, harvesters). The results also highlight model trade-offs: CART and RF (traditional ML models) performed well under clear, rule-like constraints (e.g., idle detection), whereas DL models (GRU and LSTM) captured subtle, nonlinear patterns but were more prone to overfitting – particularly when engine-related features were included. Therefore, domain expertise and a detailed understanding of machine operation remain critical for developing reliable ML and DL models for forestry machinery. Overall, the results of this study suggest that DL is the most appropriate learning approach, particularly for identifying joystick patterns.
Integrating ML into Cyber-Physical Systems and Internet of Things applications, as proposed by Humphrey et al. (2024), could enable real-time, high-resolution time study analysis of harvesting machinery. Such advancements would allow ML/DL models, like those developed in this study, to move beyond traditional time study approaches enabling near real-time monitoring of forestry operations, similar to how John Deere’s Fleet Management system operates (Bacescu et al. 2022). This could allow both contractors and management companies to monitor machinery in harvesting operations at a different level of data access. For example, contractors may have access to all available operational data, while management companies might be limited to summary metrics such as the total number of cycles completed or the area extracted.
As ML/DL models improve and the number of machines with accurate models increases, there is significant potential for the full integration of Forestry 4.0 concepts within harvesting operations. These models may evolve to include predictive capabilities, such as identifying potential equipment failures or significant engine wear, thereby alerting contractors to possible mechanical issues. This could increase the potential for data-driven decision-making by both contractors and forest managers. However, challenges of data privacy must be addressed for the appropriate use of 4.0 concepts and technologies.
5. Conclusions
This research aimed to explore the opportunities of ML in forest harvesting operations. Specifically, it examined whether machine learning could accurately predict the operational status of forwarders using CAN bus data, potentially allowing for higher accuracy and larger datasets than traditional time studies. The methodology was designed to provide researchers with a clear understanding of the process followed for fine-tuning ML models and highlights the critical role of feature importance analysis and domain expertise in achieving robust model performance. The results show promise for the use of Machine Learning in forest harvesting operations, achieving a high validation accuracy of 95.51% and the ability to generalise across different forwarders of the same make and model. Challenges remain in distinguishing between the Unloading and Loading states, and future research outlined in the discussion could likely overcome these problems.
Acknowledgments
The authors wish to thank Keith Raymond and Forest Growers Research for their support. Likewise Simon Brand Shane Hubbard and Brand Logging Ltd, and Mike Hurring, Haydon Smith and Phil Williams from Mike Hurring Logging Ltd, for their help with data acquisition.
Conflicts of Interest
The authors declare no conflict of interest. The funding sponsors had no role in the design of the study; in the collection, analyses, or interpretation of data; in the writing of the manuscript, and in the decision to publish the results.
7. References
Agarwal, H., Mahajan, G., Shrotriya, A., Shekhawat, D., 2024: Predictive Data Analysis: Leveraging RNN and LSTM Techniques for Time Series Dataset. Procedia Computer Science 235: 979–989. https://doi.org/10.1016/j.procs.2024.04.093
Akiba, T., Sano, S., Yanase, T., Ohta, T., Koyama, M., 2019: Optuna: A Next-Generation Hyperparameter Optimization Framework. Proceedings of the 25th ACM SIGKDD International Conference on Knowledge Discovery & Data Mining (KDD '19), Anchorage, USA, 2623–2631. https://doi.org/10.1145/3292500.3330701
Ala-Ilomäki, J., Salmivaara, A., Launiainen, S., Lindeman, H., Kulju, S., Finér, L., Heikkonen, J., Uusitalo, J., 2020: Assessing Extraction Trail Trafficability Using Harvester CAN-Bus Data. International Journal of Forest Engineering 31(2): 138–145. https://doi.org/10.1080/14942119.2020.1748958
Almeida, R.O., Da Silva, R.B.G., Simões, D., 2024: Cut-to-Length Harvesting Prediction Tool: Machine Learning Model Based on Harvest and Weather Features. Forests 15(8): 1398, https://doi.org/10.3390/f15081398
Arenas, R., 2026: sklearn-genetic-opt: Hyperparameter tuning and feature selection using genetic algorithms, built on top of scikit-learn (Version 0.14.0) [Computer software]. https://github.com/rodrigo-arenas/Sklearn-genetic-opt
Ayodele, T., 2010: Machine Learning Overview. New advances in machine learning, 2(9–18): 16.
Bacescu, N.M., Cadei, A., Moskalik, T., Wiśniewski, M., Talbot, B., Grigolato, S., 2022: Efficiency Assessment of Fully Mechanized Harvesting System through the Use of Fleet Management System. Sustainability 2022 14(24): 16751. https://doi.org/10.3390/su142416751
Bacescu, N.M., Hueller, S., Marchi, L., Grigolato, S., 2024: Evaluating Variables’ Influence on Forwarder Performance and Fuel Efficiency in Mountain Salvage Logging Using an Automatic Work-Element Detection Method. Forests 15(12): 2169. https://doi.org/10.3390/f15122169
Bettucci, F., Sozzi, M., Benetti, M., Sartori, L., 2024: A Data-Driven Approach to Agricultural Machinery Working States Analysis during Ploughing Operations. Smart Agricultural Technology 8: 100511. https://doi.org/10.1016/j.atech.2024.100511
Borith, T., Bakhit, S., Nasridinov, A., Yoo, K.-H., 2020: Prediction of Machine Inactivation Status Using Statistical Feature Extraction and Machine Learning. Applied Sciences 10(21): 7413. https://doi.org/10.3390/app10217413
CSS Electronics. (2025). CANEdge2: 2x CAN Bus Data Logger (SD + WiFi). CSS Electronics. https://www.csselectronics.com/products/can-bus-data-logger-wifi-canedge2
Eang, C., Lee, S., 2025: Predictive Maintenance and Fault Detection for Motor Drive Control Systems in Industrial Robots Using CNN-RNN-Based Observers. Sensors 25(1): 25 https://doi.org/10.3390/s25010025
Feng, Y., Audy, J.-F., 2020: Forestry 4.0: A Framework for the Forest Supply Chain toward Industry 4.0. Gest. Prod. 27(4): e5677. https://doi.org/10.1590/0104-530x5677-20
Géron, A., 2019: Hands-on Machine Learning with Scikit-Learn, Keras, and TensorFlow: Concepts, Tools, and Techniques to Build Intelligent Systems, Second edition., O’Reilly: Beijing Boston Farnham Sebastopol Tokyo.
Gonçalves, S.B., Fiedler, N.C., Silva, J.P.M., Da Silva, G.F., Da Silva, M.L.M., Minette, L.J., Pereira, D.P., Lopes, D.M.M., Da Silva, E.F., Ramalho, A.H.C., Santos, J.S., Aguiar, M.O., de Oliveira Melo Neto, J., de Araújo Filho, R.N., 2021: Machine Learning Techniques to Estimate Mechanised Forest Cutting Productivity. Southern Forests: a Journal of Forest Science 83(4): 276–283. https://doi.org/10.2989/20702620.2021.1994342
Hama, T., Alsaleh, M.M., Allery, F., Choi, J.W., Tomlinson, C., Wu, H., Lai, A., Pontikos, N., Thygesen, J.H., 2025: Enhancing Patient Outcome Prediction Through Deep Learning With Sequential Diagnosis Codes From Structured Electronic Health Record Data: Systematic Review. J Med Internet Res 27: e57358. https://doi.org/10.2196/57358
Holzinger, A., Schweier, J., Gollob, C., Nothdurft, A., Hasenauer, H., Kirisits, T., Häggström, C., Visser, R., Cavalli, R., Spinelli, R., Stampfer, K., 2024: From Industry 5.0 to Forestry 5.0: Bridging the Gap with Human-Centered Artificial Intelligence. Curr. For. Rep. 10(6): 442–455. https://doi.org/10.1007/s40725-024-00231-7
Hrisca, D., 2024: Asammdf [Computer software]. https://github.com/danielhrisca/asammdf?tab=readme-ov-file
Humphrey, P., Harvey, C., Visser, R., 2024: Deploying an Early-Stage Cyber-Physical System for the Implementation of Forestry 4.0 in a New Zealand Timber Harvesting Context. iForest 17(6): 353–359. https://doi.org/10.3832/ifor4651-017
Humphrey, P., Harvey, C., Visser, R., Best, T., Hooper, B., 2026: CAN Bus Joystick Data to Assess Operator Workload: A Forwarder Loading Case Study. Croat. j. for. eng. 47(1): 15–25. https://doi.org/10.5552/crojfe.2026.3915
Kim, H., Ahn, C.R., Engelhaupt, D., Lee, S., 2018: Application of Dynamic Time Warping to the Recognition of Mixed Equipment Activities in Cycle Time Measurement. Automation in Construction 87: 225–234. https://doi.org/10.1016/j.autcon.2017.12.014
Liski, E., Jounela, P., Korpunen, H., Sosa, A., Lindroos, O., Jylhä, P., 2020: Modeling the Productivity of Mechanized CTL Harvesting with Statistical Machine Learning Methods. International Journal of Forest Engineering 31(3): 253–262. https://doi.org/10.1080/14942119.2020.1820750
McDonald, T.P., Fulton, J.P. 2005: Automated Time Study of Skidders Using Global Positioning System Data. Computers and Electronics in Agriculture 48(1): 19–37. https://doi.org/10.1016/j.compag.2005.01.004
Melander, L., Einola, K., Ritala, R. 2020: Fusion of Open Forest Data and Machine Fieldbus Data for Performance Analysis of Forest Machines. Eur J Forest Res 139(2): 213–227. https://doi.org/10.1007/s10342-019-01237-8
Munis, R.A., Almeida, R.O., Camargo, D.A., Da Silva, R.B.G., Wojciechowski, J., Simões, D., 2022: Machine Learning Methods to Estimate Productivity of Harvesters: Mechanized Timber Harvesting in Brazil. Forests 13(7): 1068. https://doi.org/10.3390/f13071068
Munis, R.A., Almeida, R.O., Camargo, D.A., Da Silva, R.B.G., Wojciechowski, J., Simões, D., 2023: Tactical Forwarder Planning: A Data-Driven Approach for Timber Forwarding. Forests 14(9): 1782. https://doi.org/10.3390/f14091782
Palander, T., Nuutinen, Y., Kariniemi, A., Väätäinen, K., 2013: Automatic Time Study Method for Recording Work Phase Times of Timber Harvesting. Forest Science 59(4): 472–483. https://doi.org/10.5849/forsci.12-009
Paszke, A., Gross, S., Massa, F., Lerer, A., Bradbury, J., Chanan, G., Killeen, T., Lin, Z., Gimelshein, N., Antiga, L., Desmaison, A., Kopf, A., Yang, E., DeVito, Z., Raison, M., Tejani, A., Chilamkurthy, S., Steiner, B., Fang, L., Bai, J., Chintala, S., 2019: PyTorch: An Imperative Style, High-Performance Deep Learning Library. 33rd Conference on Neural Information Processing Systems (NeurIPS 2019), Vancouver, Canada, 12 p.
Pedregosa, F., Varoquaux, G., Gramfort, A., Michel, V., Thirion, B., Grisel, O., Blondel, M., Prettenhofer, P., Weiss, R., Dubourg, V., Vanderplas, J., Passos, A., Cournapeau, D., Brucher, M., Perrot, M., Duchesnay, E., 2011: Scikit-Learn: Machine Learning in Python. Journal of Machine Learning Research 12: 2825–2830.
Prinz, R., Väätäinen, K., Routa, J., 2021: Cutting Duration and Performance Parameters of a Harvester’s Sawing Unit under Real Working Conditions. Eur J Forest Res 140(1): 147–157. https://doi.org/10.1007/s10342-020-01320-5
Proto, A.R., Macrì, G., Visser, R., Harrill, H., Russo, D., Zimbalatti, G., 2018: Factors Affecting Forwarder Productivity. Eur J Forest Res 137(2): 143–151. https://doi.org/10.1007/s10342-017-1088-6
SAE International, 2022: Data Link Layer. SAE Standard J1939/21_202205 (originally issued 1994). https://doi.org/10.4271/J1939/21_202205
Sokolova, M., Lapalme, G., 2009: A Systematic Analysis of Performance Measures for Classification Tasks. Information Processing & Management 45(4): 427–437. https://doi.org/10.1016/j.ipm.2009.03.002
Spencer, G., Mateus, F., Torres, P., Dionísio, R., Martins, R., 2021: Design of CAN Bus Communication Interfaces for Forestry Machines. Computers 10(11): 144. https://doi.org/10.3390/computers10110144
Spencer, G., Torres, P.M.B. 2023: New Can Bus Communication Modules for Digitizing Forest Machines Functionalities in the Context of Forestry 4.0. IEEE Access 11: 9058–9066. https://doi.org/10.1109/ACCESS.2022.3232286
Strandgard, M., Mitchell, R., 2015: Automated Time Study of Forwarders Using GPS and a Vibration Sensor. Croat. j. for. eng. 36(2): 175–184.
Strauman, A.S., Bianchi, F.M., Mikalsen, K.Ø., Kampffmeyer, M., Soguero-Ruiz, C., Jenssen, R., 2018: Classification of Postoperative Surgical Site Infections from Blood Measurements with Missing Data Using Recurrent Neural Networks. In IEEE EMBS International Conference on Biomedical & Health Informatics (BHI) 307–310. https://doi.org/10.1109/BHI.2018.8333430
Visser, R., 2023: Cost and Productivity Benchmarking Update 2022. Harvesting Technical Note, Forest Growers Research Ltd, Rotorua, New Zealand.
Waleed, M., Um, T.-W., Kamal, T., Usman, S.M. 2021: Classification of Agriculture Farm Machinery Using Machine Learning and Internet of Things. Symmetry 13(3): 403. https://doi.org/10.3390/sym13030403
Wen, X., Li, W., 2023: Time Series Prediction Based on LSTM-Attention-LSTM Model. IEEE Access 11: 48322–48331. https://doi.org/10.1109/ACCESS.2023.3276628
Zhang, Q., Zhuo, Q., 2024: Estimating Forest Aboveground Biomass in Tropical Forests with Landsat Time-Series Data and Recurrent Neural Network. International Journal of Remote Sensing 45(14): 4764–4787. https://doi.org/10.1080/01431161.2024.2368930
© 2026 by the authors. Submitted for possible open access publication under the
terms and conditions of the Creative Commons Attribution (CC BY) license (http://creativecommons.org/licenses/by/4.0/).
Author’s address:
Patrick Humphrey, PhD *
e-mail: patrick.humphrey@canterbury.ac.nz
Campbell Harvey, PhD
e-mail: campbell.harvey@canterbury.ac.nz
University of Canterbury
School of Forestry
Forest Engineering
20 Kirkwood Avenue
8041, Christchurch, Ilam
NEW ZEALAND
* Corresponding author
Received: October 09, 2025
Accepted: March 28, 2026
Original scientific paper